Author: Behrouz Safari
License: MIT
A python package for astronomical calculations
Install the latest version of hypatie from PyPI:
pip install hypatie
Requirements are numpy, pandas and matplotlib.
Let's get the positions of the sun between two times:
import hypatie as hp

t1 = '2021-03-20 08:00:00'
t2 = '2021-03-20 10:00:00'
If you want the apparent RA and DEC of the Sun with respect to Earth's center (geocentric):
obs = hp.Observer('sun', t1, t2, step=5)Now you can access the time intervals with .time attribute:
print(obs.time)

[datetime.datetime(2021, 3, 20, 8, 0)
 datetime.datetime(2021, 3, 20, 8, 24)
 datetime.datetime(2021, 3, 20, 8, 48)
 datetime.datetime(2021, 3, 20, 9, 12)
 datetime.datetime(2021, 3, 20, 9, 36)
 datetime.datetime(2021, 3, 20, 10, 0)]
To acces the position you can use obs.pos, obs.ra, or obs.dec:
print(obs.pos)

[[ 3.59938235e+02 -2.66803120e-02]
 [ 3.59953431e+02 -2.00920520e-02]
 [ 3.59968627e+02 -1.35038600e-02]
 [ 3.59983823e+02 -6.91573600e-03]
 [ 3.59999018e+02 -3.27680000e-04]
 [ 1.42132560e-02  6.26030600e-03]]
The first column in the above array is RA and the second column is DEC.
It is possible to get the apparent RA & DEC of a targer with respect to a specified location on the surface of a body. For example, if you want to get the apparent RA & DEC of the Sun for the Eiffel Tower :
obs = hp.Observer('sun', t1, t2, step=5, center='2.2945,48.8584,300@399')Note that 2.2945 is the longtitude, 48.8584 is the latitude and 300 (meters) is the elevation of the Eiffel Tower. We have specified '@399' at the end which means that this coordinates is situated on the Earth (399 is the Earth's code).
You can request the cartesian positions (x,y,z) of a target with Vector class.
vec = hp.Vector('sun', t1, t2, step=5)As with the Observer class, there are two attributes .time and .pos for Vector class. Note that when creating a Vector class, you have .x, .y and .z attributes instead of .ra and .dec.
For both Vector and Observer classes you can pass a single time to get position/state of a body at a single time:
vec = hp.Vector('sun', t1)Both Vector and Observer classes have .plot() method.
# plot polar coordinates
obs.plot()
# plot cartesian coordinates
vec.plot()In addition to .plot() method of Vector and Observer classes, there's a play() function that you can pass it a list of Vector objects as well as some other lists as shown in the example below:
import hypatie as hp
import matplotlib.pyplot as plt

t1 = '2018-10-01 14:18:00'
t2 = '2024-12-31 12:18:00'

# get positions with respect to the barycenter of earth-moon
earth = hp.Vector('399', t1, t2, center='500@3', step=1000)
moon = hp.Vector('301', t1, t2, center='500@3', step=1000)
jwst = hp.Vector('-170', t1, t2, center='500@3', step=1000)

bodies = [earth, moon, jwst]
names = ['Earth', 'Moon', 'James Webb']
colors = ['b','g','r']
sizes = [20, 8, 3]

# play the animation
anim = hp.play(bodies, names, colors, sizes)
plt.show()There are several functions in hypatie.transform module. As an example, let's use the to_tete function which transforms the GCRS coordinates to True Equator True Equinox (of date):
from hypatie.transform import to_tete
import numpy as np
from datetime import datetime

t = datetime(2022, 3, 18)

# GCRS coordinates
pos = np.array([0.73859258, 0.13935437, 0.65959182])

# True Equator and True equinox of t
pos_tete = to_tete(pos, t)

print(pos_tete)
#[0.73649269 0.14295327 0.66116782]You can download data from astronomical catalogues:
from hypatie.catalogues import Catalogue

cat = Catalogue('gaia3')
data, meta = cat.download()
or, plot the star chart for your location:
from hypatie.plots import star_chart

fig, ax = star_chart(lon=2.2945, lat=48.8584)
plt.show()
or, use a virtual telescope:
from hypatie.plots import Telescope

target = (10.6847,41.2687) # az,alt of a point in the sky
paris = (2.2945, 48.8584)  # location of observer

# get image with 3 degrees field of view
tel = Telescope(target_loc=target, obs_loc=paris, fov=3)
tel.show()Let's create a chart showing the proper motion of stars near the Sgr A* (Milky Way's central supermassive black hole). The coordinates of the black hole are given and shown with the red '+' in the chart.
from hypatie.plots import explore_pm
import matplotlib.pyplot as plt

ra = 266.41681662499997
dec = -29.00782497222222

df, fig, ax = explore_pm(ra, dec, r=0.001, otype='star')
plt.show()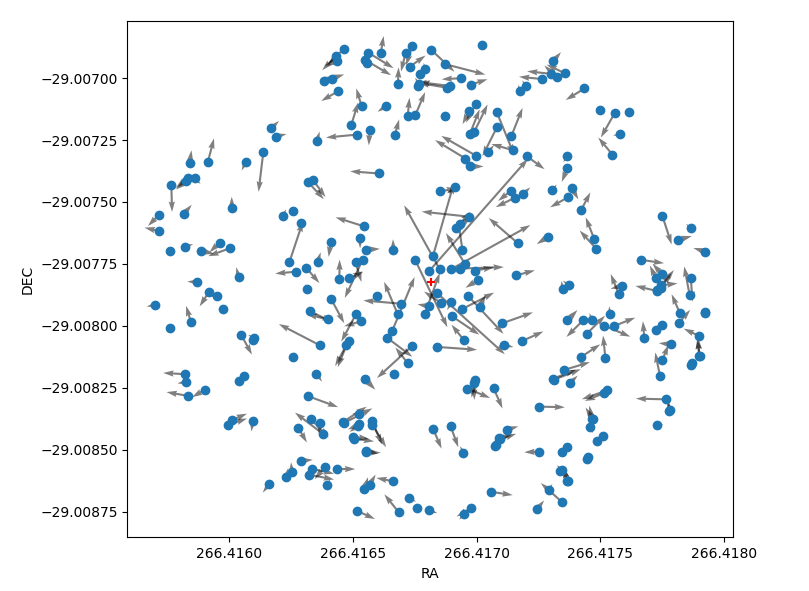
See more examples at astrodatascience.net


