Git Product home page Git Product logo

castor's Introduction

img

Castor - Forest and Land Use Simulator

Description and Usage

Castor is a spatial, large-scale analytical model for simulating forest harvest and it's potential influence on other forest values (e.g., wildlife habitat). It was first designed to support the government of British Columbia's caribou recovery program, by providing a tool to spatially estimate future forestry and caribou habitat conditions under hypothetical, alternative forest management regimes. It has since been and will continue to be expanded and developed to examine other forest values.

The code in this GitHub is open-source and provides a transparent record of the Castor model. Anyone is free to download, reproduce and apply the model. However, this is not a self-contained piece of software. In particular, using Castor as-is requires accessing our data management framework, or modifying the code here to work with your preferred data structure. The repository here also consists of code to create backend apps to develop Castor model scenarios and review outputs.

Getting Help or Reporting an Issue

We've developed a Wiki page to help you with understanding the structure and functions of the Castor model. We are also working on a tutorial that will describe the steps to get a basic Castor model up and running.

Once you are familiar with Castor, if you find any errors with the code, please submit them via the GitHub "Issues" tab.

For more information on working with the Castor team and model for a forest management problem, please don't hesitate to contact Tyler Muhly ([email protected]), Team Lead, Strategic Analysis, Forest Analysis and Inventory Branch, Office of the Chief Forester, Ministry of Forests.

Core Team

Tyler Muhly, Team Lead, Strategic Analysis, Forest Analysis and Inventory Branch, Office of the Chief Forester, Ministry of Forests

Kyle Lochhead, Ecological Modeling Specialist, Forest Analysis and Inventory Branch, Office of the Chief Forester, Ministry of Forests

Elizabeth Kleynhans, Ecological Modeling Specialist, Forest Analysis and Inventory Branch, Office of the Chief Forester, Ministry of Forests

Contributors

Mike Fowler, Spatial Data Analyst, Forest Analysis and Inventory Branch, Office of the Chief Forester, Ministry of Forests

Cora Skaien, Ecological Modeling Specialist, Forest Analysis and Inventory Branch, Office of the Chief Forester, Ministry of Forests

Requirements

The model is coded using the R programming language. Thus, you will need to download program R to work with the code. We also recommend downloading the free version of RStudio, which provides a nice integrated development environment for working with R.

R consists of many 'packages' developed by R users that bundle-up specific functions for manipulating, analyzing and visualizing data. The packages needed to run Castor are documented in the respective pieces of code where they are used, and we do not list them all here. However, we note here that you will need the open source simulation engine 'SpaDES' R package to use Castor. We recommend familiarizing yourself with this package if you want to use Castor.

License

Copyright 2020-2021 Province of British Columbia

Licensed under the Apache License, Version 2.0 (the "License"); you may not use this file except in compliance with the License. You may obtain a copy of the License at

http://www.apache.org/licenses/LICENSE-2.0

Unless required by applicable law or agreed to in writing, software distributed under the License is distributed on an "AS IS" BASIS, WITHOUT WARRANTIES OR CONDITIONS OF ANY KIND, either express or implied. See the License for the specific language governing permissions and limitations under the License.

Purpose of Castor

The purpose of Castor is compare alternative plausible scenarios of various human-centric forestry decisions in a simulation environment. The relative comparison between scenarios is the true value/purpose of these analyses, whereas, the absolute values of the outcomes should be used with caution. What is deemed plausible is left to the quality of the information being used and the resulting logic of the human-centric decisions about harvest scheduling.

Assumptions and Overview

The Castor model is a spatial strategic model used for quantifying and accounting the impacts of forest management on various indicators over long time periods. Thus, its ability to design site specific plans and their corresponding operations is very limited. Fine scale, operational decisions are important but their complexity is simplified in Castor to meet the resolution (e.g., 1 ha) and scale (e.g., multiple Timber Supply Areas, very large landscapes (> 1 M ha), long time horizons > 100 years) of the study area. The model uses empirical yield curves (from provincial growth models) to project the forest inventory (VRI) attributes into the future. Human-centric decisions around harvest scheduling are the main assumptions which include WHAT, WHERE, WHEN and HOW much timber to harvest. The model is given a demand of timber volume for each time period (i.e., the HOW much) and the goal of Castor is to “find” that timber volume while meeting various constraints like no harvest areas and aspatial land cover constraints. Castor uses some rules around minimum harvest criteria (i.e, merchantable volume > 150 m3 per ha, etc) to determine WHAT gets harvested. Castor uses a priority (closest to disturbance, oldest age, etc) to figure out the WHERE and WHEN to “find” the timber volume in a specific time period. Castor is “greedy” in that it can’t figure out how to find the optimal harvest schedule. The result of a Castor simulation is a plausible harvesting sequence that allows cutblock size, adjacency and other spatial considerations.

castor's People

Contributors

badgeronabike avatar coraskaien avatar elizabethkleynhans avatar joburgar avatar kylelochhead avatar mwfowler avatar repo-mountie[bot] avatar sasha-myaffiliates avatar sasha-ruby avatar tylermuhly avatar

Stargazers

 avatar  avatar  avatar  avatar  avatar  avatar  avatar  avatar  avatar  avatar  avatar  avatar  avatar  avatar  avatar  avatar  avatar  avatar

Watchers

 avatar  avatar  avatar  avatar  avatar  avatar  avatar  avatar  avatar  avatar  avatar  avatar  avatar

castor's Issues

roadCLUS: not simulating roads to all landings using the "pre" method

The bug
When I use "pre" method to simulate the roads in forestryCLUS, I noticed it wasn't simulating roads to new cutblocks. First, I noticed that the amount of roads being estimated in disturbanceCalcCLUS was the same each year (see table screenshot below). I then checked the harvestBlocks and road 'status' and 'year' raster outputs and noticed that roads were not being simulated to new harvest blocks (see image screen shot below; green-yellow are blocks, red are roads).

To Reproduce

  1. Run this scenario (https://github.com/bcgov/clus/blob/main/R/scenarios/central_group/bau_20220721.Rmd) with roadMethod = 'pre'. Can do this for 1 or 2 intervals (times <- list(start = 0, end = 2)). Set the scenario = data.table (name = "road_test", description = "raid test.")
  2. Input and output data is here: \\spatialfiles2.bcgov\archive\FOR\VIC\HTS\ANA\PROJECTS\CLUS\road_test

Expected behavior
Roads to landings should be simulated.

Screenshots
image

image

fisherABM: Update Territory Function

Function to update the territory of a female in response to habitat change. Will be similar to the INIT function to create territories.

fisher_abm_update_HR

FOR EACH individual_id WHERE sex = F AND age > 1
(Option: ORDER by age and/or habitat quality to give older animals and/or animals in higher quality habitat priority)

  • IF new d2_score query > current d2_score (i.e., habitat quality got worse)

THEN

  • Calculate distance from the pixelid in the agents table to all denning habitat pixels (query “pixels” table) within the female_search_radius pixels in the “search” table
  • SELECT the closest within a minimum distance to ensure clustering of pixels, unoccupied (i.e., no individual_id assigned to the pixelid in the female territories table), denning habitat pixels, up to where count (denning pixels) > (hr_size * den_target) AND assign the individual_id and pixelid to the female territories table
  • Calculate distance from the pixelid in the agents table to all resting habitat pixels (query “pixels” table) within the female_search_radius pixels in the “search” table
  • SELECT the closest, unoccupied, resting habitat pixels, up to where count (resting pixels) > (hr_size * den_target) AND assign the indivdual_id and pixelid to the female territories table
  • Calculate distance from the pixelid in the agents table to all movement habitat pixels (query “pixels” table) within the female_search_radius pixels in the “search” table
  • SELECT the closest, unoccupied, movement habitat pixels, up to where count (movement pixels) > (hr_size * den_target) AND assign the indivdual_id and pixelid to the female territories table

THEN

  • Check IF (hr_size * den_target) < count (SELECT pixelid’s that belong to the individual_id in the female “territories” table and are denning habitat in the “pixels” table)
    OR
  • IF (hr_size * rest_target) < count (SELECT pixelid’s that belong to the individual_id in the female “territories” table and are resting habitat in the “pixels” table)
    OR
  • IF (hr_size * move_target) < count (SELECT pixelid’s that belong to the individual_id in the female “territories” table and are movement habitat in the “pixels” table)
    THEN
    -Disperse (but what if has kits?)

ELSE

  • Calculate d2_score by querying the ‘pixels’ table using the pixelids for the individual_id in the female territories table

Parameters:

  • female_search_radius: maximum search radius, in metres, that a female fisher could ‘search’ to establish a territory (year?, summer/fall?; or use max diameter of a territory?)
  • den_target : desired proportion of a home range that is denning habitat
  • rest_target : desired proportion of a home range that is resting habitat
  • move_target : desired proportion of a home range that is movement habitat

CLUS Scenario Tool - staff requests for 2020

  1. Add disturbance calculation by critical habitat type; requires 'official release' of critical habitat data; check with Nicola first

  2. Upload a Shapefile for viewing and summarizing data

  3. Add habitat quality data (e.g., RSF); this may need to be refined on a herd-by-herd

  4. Add proposed new developments; again, this may need to be refined on a herd-by-herd

  5. Add additional protected area types, i.e., the four types as defined by state of environment

  6. DONE -Add road density to road disturbance tab

  7. Summarize change to 'desirable" BEC types for caribou; likely will need to be refined on a herd-by-herd

Add project lifecycle badge

No Project Lifecycle Badge found in your readme!

Hello! I scanned your readme and could not find a project lifecycle badge. A project lifecycle badge will provide contributors to your project as well as other stakeholders (platform services, executive) insight into the lifecycle of your repository.

What is a Project Lifecycle Badge?

It is a simple image that neatly describes your project's stage in its lifecycle. More information can be found in the project lifecycle badges documentation.

What do I need to do?

I suggest you make a PR into your README.md and add a project lifecycle badge near the top where it is easy for your users to pick it up :). Once it is merged feel free to close this issue. I will not open up a new one :)

CLUS Fire Module

Develop module(s) to simulate ignition and spread of fire on the landscape.

Make default values for zone rasters as a value (e.g., -99) instead of NA

Zone parameters are created with "NA" as default for areas with no value (no defined zone). It might be better to make it a value (e.g., -99) to allow functionality in using zones as constrains or priority harvest areas (rasters with NA values will not work as a priority area).

Describe the solution you'd like
When creating a raster parameter, make it standard practice to define a value, e.g.,
ALTER TABLE pixels ADD COLUMN zone1 INTEGER DEFAULT -99

The idea needs some consideration of implications and some testing before making a switch.

roadCLUS: error "Some nodes are not in the graph" when simulating roads using the 'mst' method

The bug
When running forestryCLUS with roadCLUS set to the 'mst' method it errors out with:

Jul26 13:34:57 blckng total elpsd: 20 mins | 6 blockingCLUS UpdateBlocks 2
Jul26 13:34:57 blckng update the blocks table
Jul26 13:34:59 frstry total elpsd: 20 mins | 6 forestryCLUS schedule 3
Jul26 13:34:59 frstry ...assigning zonal constraints
Jul26 13:35:08 frstry ...assigning adjacency constraint
Jul26 13:35:11 frstry central_group harvest Target: 7500000
Jul26 13:35:11 frstry Using block priority
Jul26 13:35:14 rdCLUS total elpsd: 20 mins | 6 roadCLUS buildRoads 7
Jul26 13:35:14 rdCLUS mstSolve
2022-07-26 13:35:14 ERROR::e: Some nodes are not in the graph
2022-07-26 13:35:14 ERROR::e: cppRouting::get_distance_matrix(Graph = sim$g, from = landing.cell$landings, to = sim$roadSourceID, allcores = FALSE)
Error in cppRouting::get_distance_matrix(Graph = sim$g, from = landing.cell$landings, :
Some nodes are not in the graph

Error is at roadCLUS.R Line #483, which is this fucntion:
weights.closest.rd <- cppRouting::get_distance_matrix(Graph=sim$g,
from=landing.cell$landings,
to=sim$roadSourceID,
allcores=FALSE)

This is part of the mstSolve(sim) function at roadCLUS.R#105

To Reproduce

  1. Run this scenario (https://github.com/bcgov/clus/blob/main/R/scenarios/central_group/bau_20220721.Rmd) with roadMethod = 'mst'.
  2. Input and output data is here: \spatialfiles2.bcgov\archive\FOR\VIC\HTS\ANA\PROJECTS\CLUS\road_test

Expected behavior
Should simulate roads without this error.

Add project lifecycle badge

No Project Lifecycle Badge found in your readme!

Hello! I scanned your readme and could not find a project lifecycle badge. A project lifecycle badge will provide contributors to your project as well as other stakeholders (platform services, executive) insight into the lifecycle of your repository.

What is a Project Lifecycle Badge?

It is a simple image that neatly describes your project's stage in its lifecycle. More information can be found in the project lifecycle badges documentation.

What do I need to do?

I suggest you make a PR into your README.md and add a project lifecycle badge near the top where it is easy for your users to pick it up :). Once it is merged feel free to close this issue. I will not open up a new one :)

disturbanceCalcCLUC - issues with output figures

Describe the bug
Within the CLUS Explorer App the disturbance outputs, particularly buffered disturbance are greater than 100%, resulting in outputs that are difficult to interpret. The SQL query in disturbanceCalcCLUS should also be double-checked for accuracy.

To Reproduce
Steps to reproduce the behavior:

  1. Go to CLUS Explorer
  2. Select Williams Lake Scenarios, Williams Lake BAU Scenario
  3. Open the caribou tab and disturbance buffered figures
  4. See figure outputs

Expected behavior
We want to convert to two output tabs:

  1. 'Disturbance' (forestry + permanent) as a percent of forested area, by caribou critical habitat type.

  2. 'Disturbance' (forestry + permanent) buffered by 500m as a percent of total area, by caribou critical habitat type.

error with Explorer CLUS app, caribou disturbance outputs

Describe the bug
This bug is currently (Dec. 18) exclusive to the Revelstoke TSA analysis. When using the Explorer CLUS app to view the disturbance outputs for any "v2" Revelstoke TSA scenario, in most (but not all) cases it does not show a plot for critical habitat types where no harvest was set in the scenario (e.g., if Columbia North critical habitat was set as no harvest, there is no disturbance figure for that critical habitat). On further investigation, when you look at the 'disturbance' table in the revelstoke_tsa schema of the vm, you can see that for the v2 scenarios there is only a disturbance estimate at time 0 for some of the critical habitat types; this generally (but not always) aligns with an area that was classified as 'no harvest' in the scenario. The problem therefore appears to be in the disturbanceCalcCLUS module, and in updating the 'disturbanceReport" table fro soemof teh critical habitat areas.

To Reproduce
Steps to reproduce the behavior:

  1. Run a scenario in the forestryCLUS_revelstoketsa.Rmd that includes a no harvest area for caribou (e.g., rast.zone_cond_noharvest_columbia_north_crithab_or_herd)
  2. Upon completion of the scenario, open/view the 'disturbance' table in the revelstoke_tsa schema of the vm. Filter by the scenario name you used and examine the disturbance trends for critical habitat types. You should see no values beyond timeperiod = 0 for some of the critical habitat types, typically those where you applied a no harvest constraint.
  3. You can also view on the CLUS explorer app (updated version) by looking at the disturbance outputs for caribou; you will see no trend outputs for some of the critical habitat types.

Expected behavior
The disturbance table should have disturbance estimates for all time periods, for all critical habitat types. The trends should be visible in the app.

Desktop (please complete the following information):

  • Version need to use the updated forestryCLUS.R (as of Dec. 17, 2020); pull new code if not previously done after this date

CaribouBC requests from staff for 2020/21

  1. Need to be able to pull multiple management levers simultaneously (e.g., wolf control and moose reduction)

  2. Scenario output spreadsheet should include parameters and outputs form multiple tabs, e.g., an ability to 'save scenario to spreadsheet'

  3. In the wolf and moose management tabs, include moose and wolf population responses to actions and an ability to adjust 'effort' in moose/wolf reduction

  4. Cons breeding:
    a. include males as output from captive population
    b. increase flexibility in adding wild females to the captive herd over time (e.g., add 2 animals in year 5, 3 animals in year 6, etc.)
    c. increase flexibility in turning on/off release of captive bred animals (e.g., no animals released at year 5, 2 animals released at year 6).

fisherABM: Function to create 'agents' and 'territories' tables in the INIT phase

1. Create an “agents” table that has the following columns:
• individual_id: unique integer identifier for each animal
• sex: whether the animal is ‘male’ or ‘female’
• age: how many years old the animal is
• pixelid: where the animal is located
• hr_size: the home range size of the animal
• d2_score: the mahalanobis distance score of the territory

2. Create a female “territories” table that has the following columns:
• pixelid: identifier of location on the landscape (from ‘pixels’ table)
• individual_id: the id of the female individual that is using a pixel as part of its home range

3. Assign values to the “agents” table
• individual_id = seq (from = max (individual_id), to = (max (individual_id) + n_females ), by = 1)
• age = sample (1:max_age, n_females)
• sex = F
• pixelid = SELECT pixelid FROM pixels WHERE habitat = denning; assign randomly
• hr_size = rnorm (n_females, female_hr_size_mean, female_hr_size_sd)

Parameters that need to be created:

  • n_females = number of females to ‘seed’ the landscape with; alternatively (or as an alternative option), this parameter could be the total number of denning pixels in the area of interest, and each pixel has an agent created in the table; this would fill the entire landscape with fisher
  • female_hr_size_mean = average home range size, ha; need to identify a distribution of female home range sizes
  • female_hr_size_sd = standard deviation of home range size, ha

Add project lifecycle badge

No Project Lifecycle Badge found in your readme!

Hello! I scanned your readme and could not find a project lifecycle badge. A project lifecycle badge will provide contributors to your project as well as other stakeholders (platform services, executive) insight into the lifecycle of your repository.

What is a Project Lifecycle Badge?

It is a simple image that neatly describes your project's stage in its lifecycle. More information can be found in the project lifecycle badges documentation.

What do I need to do?

I suggest you make a PR into your README.md and add a project lifecycle badge near the top where it is easy for your users to pick it up :). Once it is merged feel free to close this issue. I will not open up a new one :)

matrix disturbance random effects need to be added to caribou abundance module

The current version of the module does not include the subpopulation level random effects of matrix disturbance on abundance estimates. These need to be added to improve accuracy of the model; the current version is inaccurate.

There may also need to be a subpopulation size coefficient added to the equation. Confirm with Kyle.

To make the fix, recreate the model coefficients table, Lines 121-148.

If necessary add a coefficient for subpopulation size. If this coefficient is necessary then each subpopulation will need to be classified based on its herd size.

Old Growth Indicator (oldGrowthCLUS)

Old growth has become a significant issue in BC. We could consider including some old growth indicators in our model.

Attend June 2nd presentation on old growth data to see if there are possibilities to do this.

Cloud Computing Pilot

Develop pilot project for testing cost-effectiveness of cloud computing as part of CLUS (and FAIB) work flow.

  1. Phase 1 completed (initial training and testing on Digital Ocean to set-up Postgres and R on server)
  2. Phase 2 in progress

error in CLUS explorer app caribou outputs

Describe the bug
The forest age (Proportion Early, Proportion Mature, Proportion Old) and Survival output plots in the Caribou tab of the CLUS explorer app do not display properly. Most 'facets' are empty, adn one facet is untitled.

To Reproduce
Steps to reproduce the behavior:

  1. Open the CLUS explorer app, select any TSA and scenario (e.g., revelstoke_tsa, revelstoke_bau), click on the "Caribou" tab, open the "Proportion Early" etc. windows.

Expected behavior
Each plot should have an appropriate trend line.

Screenshots
image

modify disturbanceCalcCLUS to include treed area and total area

The 'disturbance' report from disturbanceCalcCLUS currently reports out total_area as treed area, i.e.,:

Line 161: outPts[treed == 1 & !is.na(critical_hab), .(total_area = uniqueN(.I)), by = c("compartment","critical_hab")]

This limits reporting of percent disturbance as percent of treed area disturbed. Thus, in cases where buffered roads occur, outside of treed areas, the percent disturbance can be >100.

A preferred 'disturbance' report would have total_area reported as:

outPts[!is.na(critical_hab), .(total_area = uniqueN(.I)), by = c("compartment","critical_hab")]

and treed_area reported as:
outPts[treed == 1 & !is.na(critical_hab), .(treed_area = uniqueN(.I)), by = c("compartment","critical_hab")]

This allows flexibility in summarizing by % of total or treed area disturbed.

Note: this will require updating the 'disturbance' tables already in the postgres db.

Moose Module

Develop module(s) to predict/simulate moose habitat and/or population metrics as part of CLUS

fisherABM: Dispersal Function

Function to "disperse" fisher that either: 1. aren't able to improve their habitat quality, or, 2. are mature kits (1 year old) in a home range occupied by its mother.

fisher_abm_disperse

Part 1:
SELECT individual_id WHERE pixelid IS NOT NULL AND AGE = 1 (i.e., individual is a mature kit in a home range occupied by its mother) OR habitat targets not met in (i.e., need to call this function from the update home range function)

  • Calculate distance from the pixelid in the agents table to all denning habitat pixels (query “pixels” table) within the max_female_dispersal_dist

  • SELECT the closest l(with a minimum distance to other denning pixels to ensure clustering of pixels ), unoccupied (i.e., no individual_id assigned to the pixelid in the female territories table), denning habitat pixel, up to where count (denning pixels) > (hr_size * den_target) AND where distance to the pixelid in the agents table is greater than the female_search_radius, AND assign the individual_id and pixelid to the female territories table AND randomly assign one of the denning habitat pixels to pixelid;
    need to identify a cluster of pixels, not a single pixel

  • Calculate distance from the pixelid in the agents table to all denning habitat pixels (query “pixels” table) within the female_search_radius pixels in the “search” table

  • SELECT the closest, unoccupied (i.e., no individual_id assigned to the pixelid in the female territories table), denning habitat pixels, up to where count (denning pixels) > (hr_size * den_target) AND assign the individual_id and pixelid to the female territories table

  • Calculate distance from the pixelid in the agents table to all resting habitat pixels (query “pixels” table) within the female_search_radius pixels in the “search” table

  • SELECT the closest, unoccupied, resting habitat pixels, up to where count (resting pixels) > (hr_size * rest_target) AND assign the individual_id and pixelid to the female territories table

  • Calculate distance from the pixelid in the agents table to all movement habitat pixels (query “pixels” table) within the female_search_radius pixels in the “search” table

  • SELECT the closest, unoccupied, movement habitat pixels, up to where count (movement pixels) > (hr_size * move_target) AND assign the indivdual_id and pixelid to the female territories table

Part 2:
IF (hr_size * den_target) < count (SELECT pixelid’s that belong to the individual_id in the “territories” table and are denning habitat in the “pixels” table)
OR
IF (hr_size * rest_target) < count (SELECT pixelid’s that belong to the individual_id in the “territories” table and are resting habitat in the “pixels” table)
OR
IF (hr_size * move_target) < count (SELECT pixelid’s that belong to the individual_id in the “territories” table and are movement habitat in the “pixels” table)
THEN
Remove rows with individual_id from the “territories” and “agents” table
ELSE
Calculate d2_score by querying the ‘pixels’ table using the pixelids for the individual_id in the female territories table

Parameters:

  • max_female_dispersal_dist: maximum distance, in metres, a female will disperse to find a territory
  • female_search_radius: maximum search radius, in metres, that a female fisher could ‘search’ to establish a territory (year?, summer/fall?; or use max diameter of a territory?)
  • den_target : desired proportion of a home range that is denning habitat
  • rest_target : desired proportion of a home range that is resting habitat
  • move_target : desired proportion of a home range that is movement habitat

fisherABM: Reproduction Function

Function for producing female fisher kits from reproductively mature fisher.

fisher_abm_reproduce

SELECT individual_id WHERE sex = F AND age >= reproductive_age;

  • rnorm (nrows(), denning_rate_mean, denning _rate_sd) AS denning_rate; assign a denning rate to each individual
  • rbinom (1, 1, denning_rate) AS ‘kits’; assign whether the individual has kits(1) or not(0) from a binomial draw of denning_rate
  • IF kits = 0, remove from table

ELSE

  • kits = rnorm (nrows(), litter_size_mean, litter_size_sd); assign a litter size based on distribution

FOR EACH individual_id create a data.table with agent table columns and nrows (kits)

  • ASSIGN to kits:
  • individual id = seq (from = max (agents::individual_id), to = (max (agents::individual_id) + 1, by = 1)
    • age = 0
    • location = SELECT pixelid FROM agents WHERE individual_id = individual_id
    • hr_size = rnorm (1, female_hr_size_mean, female_hr_size_sd)
    • sex = rbinom (1, 1, sex_ratio) IF 1 = “F” ELSE = “M”
    • rbind() to “agents” table
  • IF sex = “M” remove from table

Parameters:

  • reproductive_age: age that a female reaches sexual maturity
  • denning_rate_mean: Mean rate or proportion of females that den and give birth to kits
  • denning_rate_sd: standard deviation of rate or proportion of females that den and give birth to kits
  • litter_size_mean: Mean number of kits born in a litter
  • litter_size_sd: standard deviation of the number of kits born in a litter
  • female_hr_size_mean = average home range size, ha
  • female_hr_size_sd = standard deviation of home range size, ha

fisherABM: Function to create female home ranges in INIT phase

Query to assign 'pixels' in a landscape to a fisher home range (i.e., 'initiate" home ranges).

fisher_abm_create_HR

Part 1:
FOR EACH individual_id in “agents” table WHERE sex = F
(ORDER by age to give older animals priority) could consider this to prioritize older animals

  • ASSIGN individual_id and pixelid from the 'agents' table to the 'territories' table; assign the starting denning habitat pixel to the territories table

  • Calculate distance from the pixelid in the agents table to all denning habitat pixels (query “pixels” table) within the female_search_radius pixels in the “search” table;

  • SELECT the closest (and within a minimum distance to ensure clustering of pixels ), unoccupied (i.e., no individual_id assigned to the pixelid in the female territories table), denning habitat pixels, up to where count (denning pixels) > (hr_size * den_target) AND assign the individual_id and pixelid to the female territories table;

  • Calculate distance from the pixelid in the agents table to all resting habitat pixels (query “pixels” table) within the female_search_radius pixels in the “search” table

  • SELECT the closest, unoccupied, resting habitat pixels, up to where count (resting pixels) > (hr_size * den_target) AND assign the individual_idand pixelid to the female territories table

  • Calculate distance from the pixelid in the agents table to all movement habitat pixels (query “pixels” table) within the female_search_radius pixels in the “search” table

  • SELECT the closest, unoccupied , movement habitat pixels, up to where count (movement pixels) > (hr_size * den_target) AND assign the indivdual_id and pixelid to the female territories table

Part 2:
IF (hr_size * den_target) < count (SELECT pixelid’s that belong to the individual_id in the “territories” table and are denning habitat in the “pixels” table)
OR
IF (hr_size * rest_target) < count (SELECT pixelid’s that belong to the individual_id in the “territories” table and are resting habitat in the “pixels” table)
OR
IF (hr_size * move_target) < count (SELECT pixelid’s that belong to the individual_id in the “territories” table and are movement habitat in the “pixels” table)
THEN
Remove rows with individual_id from the “territories” and “agents” table
ELSE
Calculate d2_score by querying the ‘pixels’ table using the pixelids for the individual_id in the female territories table

Model Parameters

  • female_search_radius: maximum search radius, in metres, that a female fisher could ‘search’ to establish a territory; (year?, summer/fall?; or use max diameter of a territory?)
  • den_target : desired proportion of a home range that is denning habitat
  • rest_target : desired proportion of a home range that is resting habitat
  • move_target : desired proportion of a home range that is movement habitat

Error when schema exists in db, but no tables in schema

When a schema gets created as part of the uploaderCLUS it looks to see if the schema exists and whether there are tables in the schema to delete (Line 77, uploaderCLUS.R). However, if the schema exists, but there are no tables, it throws an error at Line 83.

To Reproduce
Steps to reproduce the behavior:

  1. Create an empty schema in the postgres database and make that the name of the schema (aoiName) in uploaderCLUS
  2. Run the dataloaderCLUS module (with the uploaderCLUS settings as above)
  3. See postgres error, "cannot execute DELETE...."

Expected behavior
Needs an if/else statement to look to see if the schema is empty, and if it is empty, insert the table, rather then try to delete it.

fisherABM: Survival Function

Function to calculate survival of fisher.

fisher_abm_survive

Part 1:
IF age > max_age THEN remove agent from “agents” table AND from the “territories” table

Part 2:
FOR EACH age (i.e., each age class with a unique survival rate) AND individual_id WHERE sex = F

  • Calculate survival_rate = rnorm (1, survival_rate_table::surv_mean WHERE age = xx AND sex = F, survival_rate_table::surv_sd WHERE age = xx AND sex = F)

  • Adjust survival_rate = (survival_rate * d2_survival_adj) - based on the d2_score; adjust survival based on habitat qaulity

  • rbinom (1, 1, survival_rate) AS ‘survived’

  • IF survived = 0, remove agent from “agents” table AND from the female “territories” table AND remove agent(s) from “agents” table at the same pixelid (i.e., any kits)

  • ELSE update age = age + time_step (year)

Parameters:

  • The key parameter here is a survival rate table/function that adjust survival based on age and habitat quality
  • survival_rate_table : a table of survival rates by age class; mean and sd for each
  • max_age : the maximum age of an individual; individual ‘dies’ if greater than this age
  • d2_survival_adj: adjustment factor/function for survival based on d2 score
    surv_mean

error with rsfCLUS when running dataloaderCLUS

Describe the bug
When running dataLoaderCLUS with rsfCLUS module, throws an error (see below). Issue appears to be at Line 518 of rsfCLUS.R

To Reproduce
Steps to reproduce the behavior:

  1. Run the dataloaderCLUS on Tyler's machine with rsfCLUS module

  2. Console error:
    storing covariates in rsfcovar table
    predicting RSF
    Error in [.data.table(rsf_model_coeff, rsf == rsfPops[[1]][[i]], "minv") :
    column(s) not found: minv

  3. Traceback error:

  4. stop("column(s) not found: ", paste(ansvars[is.na(ansvals)], collapse = ", "))

  5. [.data.table(rsf_model_coeff, rsf == rsfPops[[1]][[i]], "minv") at rsfCLUS.R#518

  6. rsf_model_coeff[rsf == rsfPops[[1]][[i]], "minv"] at rsfCLUS.R#518

  7. predictRSF(sim) at rsfCLUS.R#63

  8. get(moduleCall, envir = fnEnv)(sim, cur[["eventTime"]], cur[["eventType"]])

  9. eval(fnCallAsExpr)

  10. eval(fnCallAsExpr)

  11. .runEvent(sim, cacheIt, debug, moduleCall, fnEnv, cur, notOlderThan)

  12. doEvent(sim, debug = debug, notOlderThan = notOlderThan)

  13. spades(mySim)

  14. spades(mySim)

  15. system.time({ mysimout <- spades(mySim) })

Expected behavior
Should run the datalaoderCLUS with rsfCLUS module.

fsdfsdef

Is your feature request related to a problem? Please describe.
A clear and concise description of what the problem is. Ex. I'm always frustrated when [...]

Describe the solution you'd like
A clear and concise description of what you want to happen.

Describe alternatives you've considered
A clear and concise description of any alternative solutions or features you've considered.

Additional context
Add any other context or screenshots about the feature request here.

Define a no harvest period for nameZonePriorityRaster (harvest priority) zones

There may be interest in defining periods where a harvest area is 'turned off' (no harvest) for some defined period of time. For example, make a landscape unit no harvest for 40 years as an access control measure.

Describe the solution you'd like
Some ability to define a "fallow" period for a nameZonePriorityRaster. Need to consider how to 'maximize' harvest in the zone prior to 'closing' it for the fallow period.

roadCLUS mst too slow

Describe the bug
Finding least-cost paths (lcp) is an expensive process. Long routes add greater expenses. Need to shorten the routes to only those segments that are needed. In other words, avoid lcp that are already roaded.

To Reproduce
Simulate any cutblock sequence with spatially dispersed harvest units.

Expected behaviour
Simulate lcp with only the connections between: harvest unit to harvest unit and harvest unit to nearest road pixel

fisherABM: populate input parameters

Input Parameters:
n_females = number of females to ‘seed’ the landscape with
female_hr_size_mean = average home range size, ha
female_hr_size_sd = standard deviation of home range size, ha
max_age : the maximum age of an individual; individual ‘dies’ if greater than this age
female_search_radius: maximum search radius, in metres, that a female fisher could ‘search’ to establish a territory (year?, summer/fall?; or use max diameter of a territory?)
den_target : desired proportion of a home range that is denning habitat
rest_target : desired proportion of a home range that is resting habitat
move_target : desired proportion of a home range that is movement habitat
time_step: time step of model interval, in years
survival_rate_table : a table of survival rates by sex and age class; mean and sd for each
d2_survival_adj: adjustment factor/function for survival based on d2 score
reproductive_age: age that a female reaches sexual maturity
denning_rate_mean: Mean rate or proportion of females that den and give birth to kits
denning_rate_sd: standard deviation of rate or proportion of females that den and give birth to kits
litter_size_mean: Mean number of kits born in a litter
litter_size_sd: standard deviation of the number of kits born in a litter
sex_ratio: the ratio of females to males in a litter
max_female_dispersal_dist: maximum distance, in metres, a female will disperse to find a territory

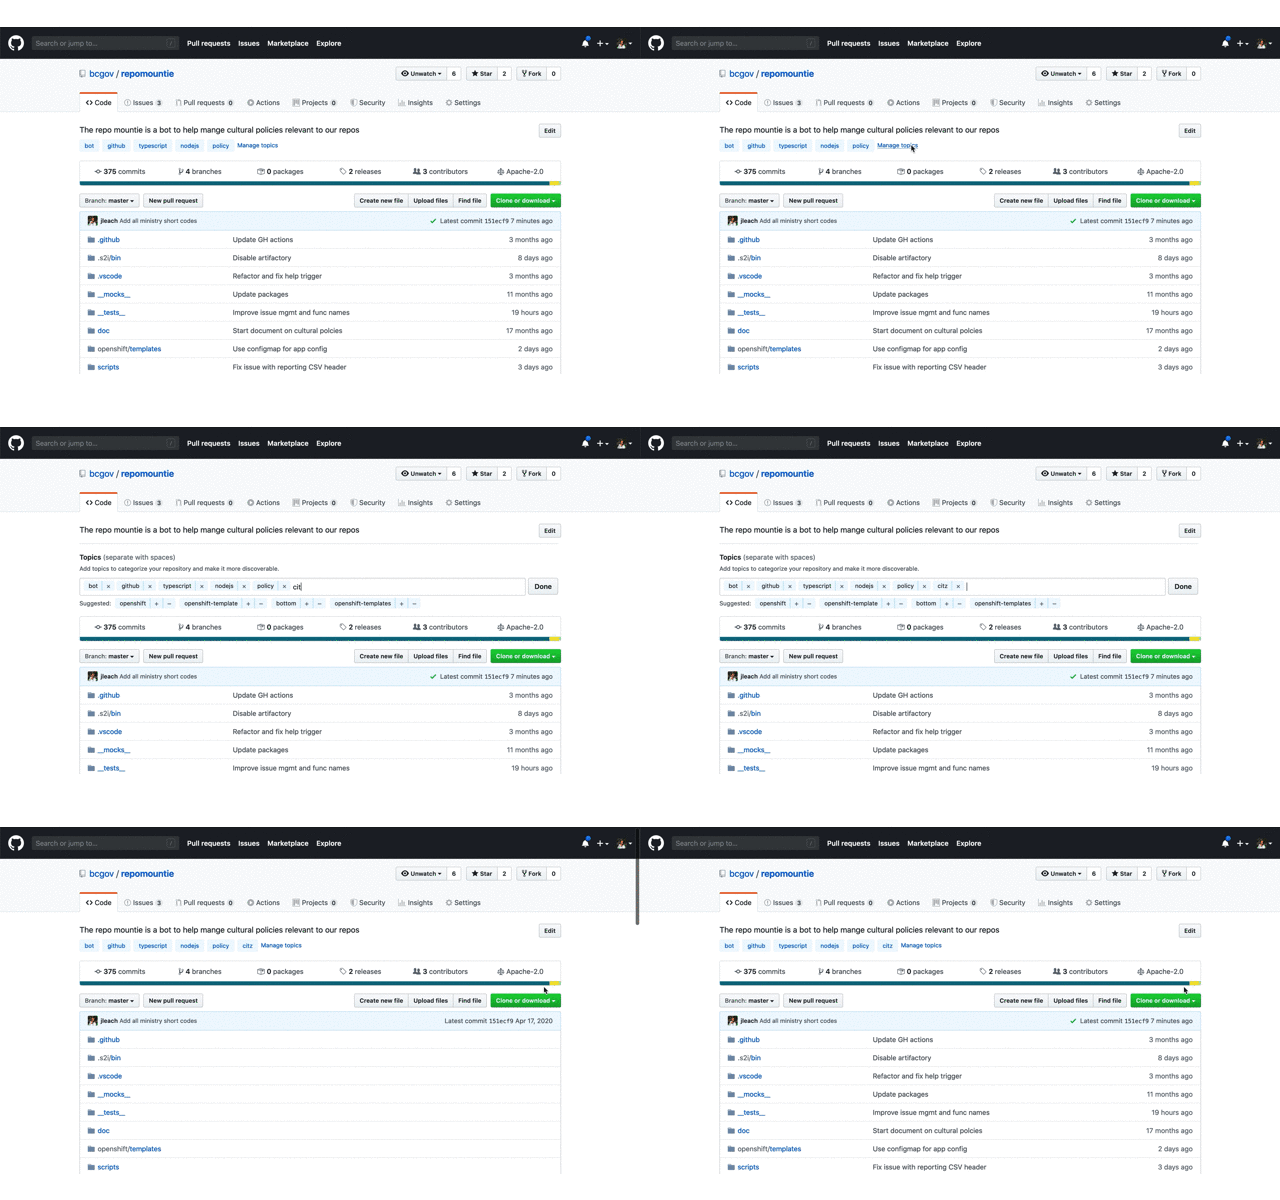
Add missing topics

TL;DR

Topics greatly improve the discoverability of repos; please add the short code from the table below to the topics of your repo so that ministries can use GitHub's search to find out what repos belong to them and other visitors can find useful content (and reuse it!).

Why Topic

In short order we'll add our 800th repo. This large number clearly demonstrates the success of using GitHub and our Open Source initiative. This huge success means its critical that we work to make our content as discoverable as possible; Through discoverability, we promote code reuse across a large decentralized organization like the Government of British Columbia as well as allow ministries to find the repos they own.

What to do

Below is a table of abbreviation a.k.a short codes for each ministry; they're the ones used in all @gov.bc.ca email addresses. Please add the short codes of the ministry or organization that "owns" this repo as a topic.

add a topic

That's in, you're done!!!

How to use

Once topics are added, you can use them in GitHub's search. For example, enter something like org:bcgov topic:citz to find all the repos that belong to Citizens' Services. You can refine this search by adding key words specific to a subject you're interested in. To learn more about searching through repos check out GitHub's doc on searching.

Pro Tip 🤓

  • If your org is not in the list below, or the table contains errors, please create an issue here.

  • While you're doing this, add additional topics that would help someone searching for "something". These can be the language used javascript or R; something like opendata or data for data only repos; or any other key words that are useful.

  • Add a meaningful description to your repo. This is hugely valuable to people looking through our repositories.

  • If your application is live, add the production URL.

Ministry Short Codes

Short Code Organization Name
AEST Advanced Education, Skills & Training
AGRI Agriculture
ALC Agriculture Land Commission
AG Attorney General
MCF Children & Family Development
CITZ Citizens' Services
DBC Destination BC
EMBC Emergency Management BC
EAO Environmental Assessment Office
EDUC Education
EMPR Energy, Mines & Petroleum Resources
ENV Environment & Climate Change Strategy
FIN Finance
FLNR Forests, Lands, Natural Resource Operations & Rural Development
HLTH Health
FLNR Indigenous Relations & Reconciliation
JEDC Jobs, Economic Development & Competitiveness
LBR Labour Policy & Legislation
LDB BC Liquor Distribution Branch
MMHA Mental Health & Addictions
MAH Municipal Affairs & Housing
BCPC Pension Corporation
PSA Public Safety & Solicitor General & Emergency B.C.
SDPR Social Development & Poverty Reduction
TCA Tourism, Arts & Culture
TRAN Transportation & Infrastructure

NOTE See an error or omission? Please create an issue here to get it remedied.

CLUS Scenario Tool - Fire Query Error

There's an error when you try to query fire disturbance.

Steps to reproduce the behavior:

  1. Click on a herd
  2. Click on the "Disturbance" tab
  3. Click on "Fire"
  4. See error: object 'fire_year' not found

Expected behavior
It should provide a summary of area burned, by year.

Improve /clus/tree/master/R/apps/testApp

  1. add caribou population data output (and trend?) using ggplot
  2. add spatial caribou telemetry location and/or home range data
  3. add other types of protected areas (e.g., parks)
  4. cut disturbance, allow user to adjust cutblock age
  5. add spatial fire/cut data
  6. update with RSF, possibly new climate data (when complete)
  7. calculate disturbance area/range; allow user to adjust disturbance buffers

CLUS/SELES comparison analysis

Joint TSR analysis with CLUS and SELES models.

Compare results of completing Revelstoke timber supply review analysis using CLUS model and SELES models.

To do:

  1. Yield curves into CLUS
  2. Net-down process and inputs into CLUS

Add ability to make nameZonePriorityRaster have a defined 'no harvest' period

There may be interest in defining periods where a harvest area is 'turned off' (no harvest) for some defined period of time. For example, make a landscape unit no harvest for 40 years as an access control measure.

Describe the solution you'd like
Some ability to define a "fallow" period for a nameZonePriorityRaster. Need to consider how to 'maximize' harvest in the zone prior to 'closing' it for the fallow period.

Berry module

Develop module for predicting/simulating huckleberry and soap berry (i.e., grizzly bear food) distribution.

Overhaul SQL statements to use 'glue' package

In clus modules, sql statements or parameterized queries are written with paste or paste0. We should move towards using the glue package for easy string interpolation. The idea is that variables can be passed into strings which improves readability and maintenance.

CLUS scenario tool - upload shapefile error "not valid"

I was trying to upload a shapefile in the CLUS scenario app, and got an error that the shapefile was not valid

To Reproduce

  1. Go to scenario tool app
  2. Click on "Click to Upload" under Upload Shapefile
  3. Navigate to a shapefile and highlight.shp, .dbf, .shx and .prj files
  4. Get error: "Shapefile not valid"

The shapefile should upload without error and be visible on the map

Recommend Projects

  • React photo React

    A declarative, efficient, and flexible JavaScript library for building user interfaces.

  • Vue.js photo Vue.js

    🖖 Vue.js is a progressive, incrementally-adoptable JavaScript framework for building UI on the web.

  • Typescript photo Typescript

    TypeScript is a superset of JavaScript that compiles to clean JavaScript output.

  • TensorFlow photo TensorFlow

    An Open Source Machine Learning Framework for Everyone

  • Django photo Django

    The Web framework for perfectionists with deadlines.

  • D3 photo D3

    Bring data to life with SVG, Canvas and HTML. 📊📈🎉

Recommend Topics

  • javascript

    JavaScript (JS) is a lightweight interpreted programming language with first-class functions.

  • web

    Some thing interesting about web. New door for the world.

  • server

    A server is a program made to process requests and deliver data to clients.

  • Machine learning

    Machine learning is a way of modeling and interpreting data that allows a piece of software to respond intelligently.

  • Game

    Some thing interesting about game, make everyone happy.

Recommend Org

  • Facebook photo Facebook

    We are working to build community through open source technology. NB: members must have two-factor auth.

  • Microsoft photo Microsoft

    Open source projects and samples from Microsoft.

  • Google photo Google

    Google ❤️ Open Source for everyone.

  • D3 photo D3

    Data-Driven Documents codes.