This single-page Shiny app is intended to help people learn (and teach) about fundamentals of data science, and (hopefully) to make it easier for subject matter experts to participate in the initial rounds of the modeling process. The basic idea is to interactively visualize the effects of simplification (pruning) on the performance of decision trees, so that you can try to discover simple rules that describe or predict the realtionships between inputs and outcomes in the data. For more details see the Powerpoint presentation.
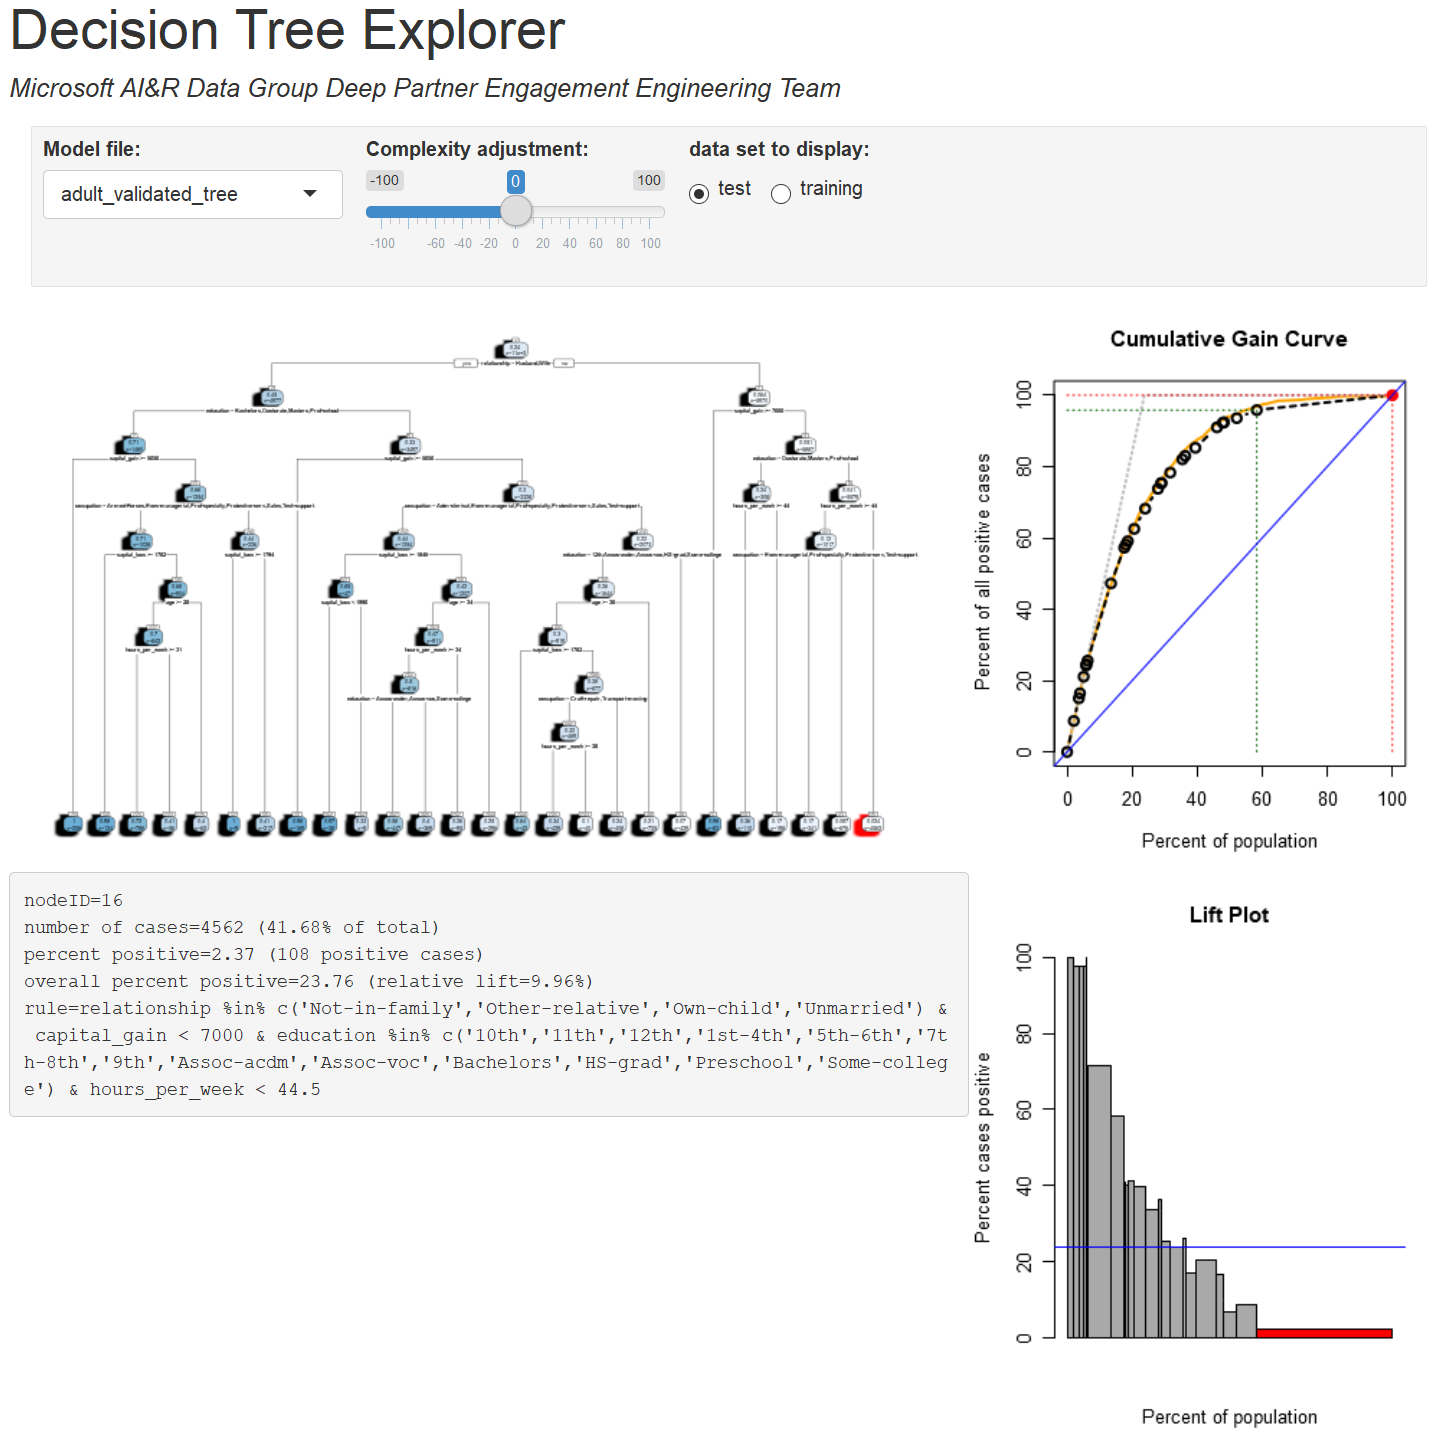
Here is a screenshot of the app in action:
To run it yourself, download the repo, open the RMarkdown file decision_tree_explorer.Rmd in RStudio, and run it.
Lift plots and cumulative gain curves are calculated from pre-computed values stored in the tree, so only the model (not the actual data) is required to visualize the performance of a pruned tree. The rule for reaching each node in the tree, as well as the number of cases and proportion of positive cases in the test set for each node are pre-computed and attached to the tree object, so the app only needs to perform simple calculations to draw the visualizations.
Choose a model file from the drop-down list. These models are decision trees that have been trained on one subset of data (the training dataset), and their performance has been validated on another subset (the test data). The test set performance indicates how well the model works on data it has not seen before.
Use the "complexity adjustment" control to make the model simpler or more complex by pruning the tree.
Display the "training" dataset to see the model performance on the data it was trained on. Differences between training set performance and test set performance usually reflect overfitting.
The lift plot shows a bar for each leaf in the tree. The width of the bar shows how many cases it covers, and the height shows the percent of those cases that are positive. The order of the bars is based on their height in the training set. If bars for the test set are not in order from tallest to shortest, this is a sign of overfitting.
The cumulative gain plot is basically the integral of the lift plot, and it has the same x-axis. The dotted gray line shows what the performance of a perfect classifier would look like, and the yellow curve shows the performance of the unpruned tree. An unpruned tree will usually perform better on the training set than on the test set, due to overfitting.
The Shiny app uses augmented rpart decision trees created by the train_validated_tree function in the file decision_tree_explorer_lib.R. The function generate_titanic_validated_tree is just a wrapper for example code that illustrates the process.
If the MicrosoftML RevoScaleR package is available it will be used to build the initial trees; otherwise trees will be trained using the open source rpart package. The RevoScaleR trees will be converted to rpart objects.
- documentation
- simplified rules
- report complexity parameter value in info box
This project welcomes contributions and suggestions. Most contributions require you to agree to a Contributor License Agreement (CLA) declaring that you have the right to, and actually do, grant us the rights to use your contribution. For details, visit https://cla.microsoft.com.
When you submit a pull request, a CLA-bot will automatically determine whether you need to provide a CLA and decorate the PR appropriately (e.g., label, comment). Simply follow the instructions provided by the bot. You will only need to do this once across all repos using our CLA.
This project has adopted the Microsoft Open Source Code of Conduct. For more information see the Code of Conduct FAQ or contact [email protected] with any additional questions or comments.
![microsoft-github-policy-service[bot] avatar](https://avatars.githubusercontent.com/in/95686?v=4 "microsoft-github-policy-service[bot]")


