HOTOSM WorldPop vs OSM Coverage
This projects trains a model of population from WorldPop raster vs OSM building footprint from MapBox QA tiles in order to generate estimates of completeness for OSM building coverage.
Building
This project uses Apache Spark and is expected to be run through spark-submit command line tool.
In order to generate the assembly .jar file required for this tool the following command is used:
./sbt assemblyThis will bootstrap the Scala Build Tool and built the assembly and requires only java version 1.8 to be available.
Running
Project defines multiple main files, for training a model of OSM based on WorldPop raster and for predicting OSM coverage based on trained model. They can be called through spark-submit as follows:
spark-submit --master "local[*]" --driver-memory 4G \
    --class com.azavea.hotosmpopulation.TrainApp \
    target/scala-2.11/hot-osm-population-assembly.jar \
    --country botswana \
    --worldpop file:/hot-osm/WorldPop/BWA15v4.tif \
    --qatiles /hot-osm/mbtiles/botswana.mbtiles \
    --model /hot-osm/models/botswana-regression

spark-submit --master "local[*]" --driver-memory 4G \
    --class com.azavea.hotosmpopulation.PredictApp \
    target/scala-2.11/hot-osm-population-assembly.jar \
    --country botswana \
    --worldpop file:/hot-osm/WorldPop/BWA15v4.tif \
    --qatiles /hot-osm/mbtiles/botswana.mbtiles \
    --model /hot-osm/models/botswana-regression \
    --output /hot-osm/botswana.json
The arguments appearing before the hot-osm-population-assembly.jar are to spark-submit command.
The arguments appearing after the JAR are specific to the application:
country: ADM0_A3 country code or name, used to lookup country boundary
worldpop: URI to WorldPop raster, maybe file:/ or s3:// scheme.
qatiles: Path to MapBox QA .mbtiles file for the country, must be local.
model: Path to save/load model directory, is must be local.
output: Path to generate prediction JSON output, must be local.
For development the train and predict commands can are scripted through the Makefile:
make train WORKDIR=/hot-osm
make predict WORKDIR=/hot-osm
prediction.json
Because WorldPop and OSM have radically different resolutions for comparison to be valid they need to be aggregated to a common resolution. Specifically WorldPop will identify population centers and evenly spread estimated population for that center over each pixel. Whereas OSM building footprints are quite resolute and are covered can vary from pixel to pixel on 100m per pixel raster.
Experimentally we see that aggregating the results per tile at zoom level 12 on WebMercator TMS layout produces visually useful relationship.
The output of model prediction is saved as JSON where a record exist for every zoom level 12 TMS tile covering the country.
The key is "{zoom}/{column}/{row}" following TMS endpoint convention.
{
    "12/2337/2337": {
        "index": 1.5921462086435942,
        "actual": {
            "pop_sum": 14.647022571414709,
            "osm_sum": 145.48814392089844,
            "osm_avg": 72.74407196044922
        },
        "prediction": {
            "osm_sum": 45872.07371520996,
            "osm_avg": 45.68931644941231
        }
    }
}
Units are:
pop: estimated population
osm: square meters of building footprint
Why _sum and _avg? While visually the results are aggregated to one result per zoom 12 tile, training and prediction is happening at 16x16 pixels per zoom 12 tile.
At this cell size there is enough smoothing between WorldPop and OSM to start building regressions.
index is computed as (predicted - actual) / predicted, it will:
- show negative for areas with low OSM coverage for WorldPop population coverage
- show positive for areas with OSM coverage greater than WorldPop population coverage
- stay close to
0where the ratio of OSM/WorldPop coverage is average
Docker
Docker images suitable for AWS Batch can be built and pushed to ECR using:
make docker
aws ecr get-login --no-include-email --region us-east-1 --profile hotosm
docker login -u AWS ... # copied from output of above command
make push-ecr ECR_REPO=670261699094.dkr.ecr.us-east-1.amazonaws.com/hotosm-population:latest
The ENTRYPOINT for docker images is docker/task.sh which handles the setup for the job.
Note that task.sh uses positional arguments where all file references may refer use s3:// scheme.
The three arguments are are required in order:
COMMAND:trainorpredictCOUNTRY: Country name to download mbtilesWORLDPOP: Name of WorldPop tiff or S3 URI to WorldPop tiff
The container may be run locally with:
docker run -it --rm -v ~/.aws:/root/.aws hotosm-population predict botswana s3://bucket/WorldPop/BWA15v4.tif
# OR
docker run -it --rm -v ~/.aws:/root/.aws hotosm-population predict botswana BWA15v4.tif
Methodology
Our core problem is to estimate the completeness of Open Street Map coverage of building footprints in areas where the map is known to be incomplete.
In order to produce that expectation we need to correlate OSM building footprints with another data set.
We assume population to be the driving factor for building construction so we use WorldPop as the independent variable.
Thus we're attempting to derive a relationship between population and building area used by that population.
OpenStreetMap
OSM geometries are sourced from MapBox OSM QA tiles.
They are rasterized to a layer with CellSize(38.2185,38.2185) in Web Mercator projection, EPSG:3857.
This resolution corresponds to TMS zoom level 15 with 256x256 pixel tiles.
The cell value is the area of the building footprint that intersects pixel footprint in square meters.
If multiple buildings overlap a single pixel their footprints are combined.
At this raster resolution resulting pixels cover buildings with sufficient precision:
| Satellite | Rasterized Buildings |
|---|---|
 |
 |
WorldPop
WorldPop raster is provided in EPSG:4326 with CellSize(0.0008333, 0.0008333), this is close to 100m at equator.
Because we're going to be predicting and reporting in EPSG:3857 we reproject the raster using SUM resample method, aggregating population density values.
Comparing WorldPop to OSM for Nata, Batswana reveals a problem:
| WorldPop | WorldPop + OSM | OSM + Satellite |
|---|---|---|
 |
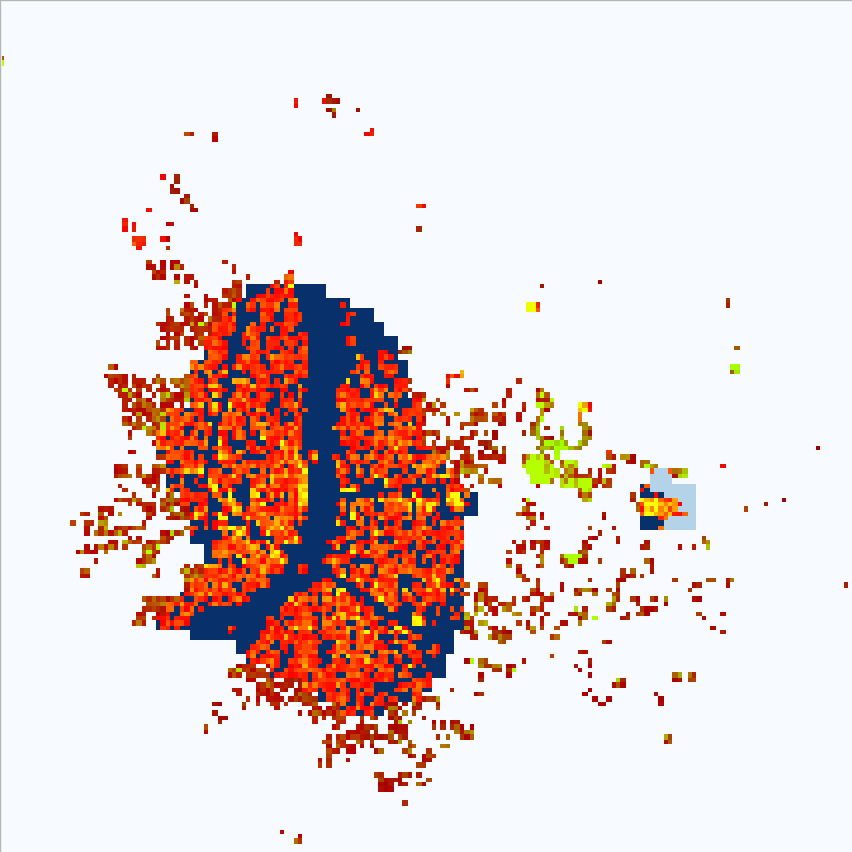 |
 |
Even though WorldPop raster resolution is ~100m the population density is spread evenly at 8.2 ppl/pixel for the blue area.
This makes it difficult to find relation between individual pixel of population and building area, which ranges from 26 to 982 in this area alone.
The conclusion is that we must aggregate both population and building area to the point where they share resolution and aggregate trend may emerge.
Plotting a sample of population vs building area we see this as stacks of multiple area values for single population area:

Its until we reduce aggregate all values at TMS zoom 17 that a clear trend emerges:

Finding line of best fit for gives us 6.5 square meters of building footprint per person in Botswana with R-squared value of 0.88069.
Aggregating to larger areas does not significantly change the fit or the slope of the line.
Data Quality
Following data quality issues have been encountered and considered:
Estimates of WorldPop population depend on administrative census data. These estimates data varies in quality and recency from country to country. To avoid training on data from various sources we fit a model per country where sources are most likely to be consistent, rather than larger areas.
WorldPop and OSM are updated at different intervals and do not share coverage. This leads to following problems:
- Regions in WorldPop showing population that are not covered by OSM
- Regions in OSM showing building footprints not covered by WorldPop
- Incomplete OSM coverage per Region
To address above concerns we mark regions where OSM/WorldPop relation appears optimal, this allows us to compare other areas and reveal the above problems using the derived model. For further discussion and examples see training set documentation.
Workflow
Overall workflow as follows:
Preparation
- Read WorldPop raster for country
- Reproject WorldPop to
EPSG:3857TMS Level 15 at256x256pixel tiles. - Rasterize OSM building footprints to
EPSG:3857TMS Level 15 at256x256pixel tiles. - Aggregate both population and building area to
4x4tile usingSUMresample method.
Training
- Mask WorldPop and OSM raster by training set polygons.
- Set all OSM
NODATAcell values to0.0. - Fit and save
LinearRegressionModelto population vs. building area.- Fix y-intercept at '0.0'.
Prediction
- Apply
LinearRegressionModelto get expected building area. - Sum all of
4x4pixel in a tile. - Report
- Total population
- Actual building area
- Expected building area
- Completeness index as
(actual area - expect area) / expected area
Because the model is derived from well labeled areas which we expect it to be stable in describing the usage building space per country. This enables us to re-run the prediction process with updated OSM input and track changes in OSM coverage.


