awesome-panel / panel-highcharts Goto Github PK
View Code? Open in Web Editor NEW📈 The panel-highcharts package makes it easy to use HighCharts in Python, Notebooks and with HoloViz Panel.
License: Other
📈 The panel-highcharts package makes it easy to use HighCharts in Python, Notebooks and with HoloViz Panel.
License: Other
This code fails due to inconsistent keys between highbase.py and the other models.
ph.config.js_files(highcharts_no_data=True)
Missing support to the module variwide: https://www.highcharts.com/docs/chart-and-series-types/variwide-chart#!
A quite useful module for plotting supply stacks for example ;)
It is also not present in HS file service https://code.highcharts.com/ and not part of panel_highcharts.config.js_files
Thanks for this promising package.
I can run pip install panel-highcharts but not pip-install panel-highcharts[examples]. The latter gives me a "no matches found" error.
panel-highcharts-20221018.1
panel==0.14.4
matplotlib==3.7.1
numpy==1.24.3
pandas==2.0.1pip

___installed--
node 10.24.1
python 3.11
running on Mac M1 Studion/an/an/a
Hi. Great product thanks!
I have data with [[date, value]] being sent to high charts and the mouse-over feature shows the date properly but the x-axis shows in milli-seconds or 1970 if I use a format string on the config.
import panel_highcharts as ph
import numpy as np
import panel as pn
ph.config.theme("auto")
pn.extension('highchart')
raw = np.array([['2020-01-02T00:00:00.000', 0.08724838802601927],
['2020-01-03T00:00:00.000', 0.3505050980452534],
['2020-01-07T00:00:00.000', 0.20308500006387006],
['2020-01-08T00:00:00.000', 0.30082278389285844],
['2020-01-09T00:00:00.000', 0.1532198747144695],
['2020-01-13T00:00:00.000', 0.29617460579831706],
['2020-01-14T00:00:00.000', 0.3101317710656381],
['2020-01-15T00:00:00.000', 0.26286860757963615],
['2020-01-16T00:00:00.000', 0.2246060860444374],
['2020-01-17T00:00:00.000', 0.23607952701269072]])
data= [{'name': 'labels',
'data': raw[:,0]},
{'name': 'random',
'data': raw[:,1]}]
configuration = {
"zoomType": 'x',
"title": {"text": "broken dates!"},
"xAxis": {"type": 'datetime', "labels": {"formatter": "function() {return Highcharts.dateFormat('%b/%e/%Y', this.value);}"}},
"yAxis": {"title": {"text": 'random'}},
"legend": {"enabled": True},
"series": data
}
chart = ph.HighChart(object=configuration, sizing_mode="stretch_width")
Would be pretty cool if the JS errors like below could be somehow caught and raised as a python exception?

When testing on panel 0.13.0rc5 I get
2022-04-07 21:07:49,779 Error running application handler <bokeh.application.handlers.script.ScriptHandler object at 0x0000029BC561FE50>: cannot import name 'string_types' from 'panel.util' (c:\repos\private\awesome-panel\.venv\lib\site-packages\panel\util.py)
File 'charts.py', line 6, in <module>:
from panel.util import lazy_load, string_types Traceback (most recent call last):
  File "c:\repos\private\awesome-panel\.venv\lib\site-packages\bokeh\application\handlers\code_runner.py", line 231, in run
    exec(self._code, module.__dict__)
  File "C:\repos\private\awesome-panel\awesome_panel\apps\highcharts_add_series_dynamically.py", line 3, in <module>
    import panel_highcharts as ph
  File "c:\repos\private\awesome-panel\.venv\lib\site-packages\panel_highcharts\__init__.py", line 7, in <module>
    from .charts import HighChart, HighGantt, HighMap, HighStock
  File "c:\repos\private\awesome-panel\.venv\lib\site-packages\panel_highcharts\charts.py", line 6, in <module>
    from panel.util import lazy_load, string_types
ImportError: cannot import name 'string_types' from 'panel.util' (c:\repos\private\awesome-panel\.venv\lib\site-packages\panel\util.py)When running mypy on code using panel_highcharts we get found module but no type hints or library stubs.
Please fix
Unless I am mistaken, there is no support for the Highchart Wind Barb capability within the current version of panel-highcharts. Could I request for this feature to be added, please?
https://code.highcharts.com/modules/windbarb.js
Highchart's wind barb feature offers a simple & flexible wind speed & direction viz that I haven't found elsewhere (JS or python). A Python wrapper would be ace, nothing else does quite the same thing (surprisingly).
missingModuleFor: packedbubble;
the highcharts-more.js file must be loaded
I created a simple dashboard with panel.Tabs. When I add a highstock chart to a a tab using panel_highcharts the slider and the button of the chart appear in every tabs. Here is a reproducible example:
import panel_highcharts as ph
import panel as pn
import pandas as pd
import numpy as np


pn.extension('highstock')


def convert_returns(returns):
    prices = (1 + returns).cumprod().to_list()
    timestamps = list(returns.index.map(lambda x: int(float(x.to_datetime64()) / 1_000_000)))
    return list(map(list, zip(timestamps, prices)))


def plot_returns_highcharts(returns):
    data = convert_returns(returns)
    configuration = {
        "rangeSelector": {
            "inputEnabled": False,
        },
        "series": [
            {"name": "series", "type": "line", "data": data, "tooltip": {"valueDecimals": 2}}
        ],
        "yAxis": {
            "labels": {
                "formatter": """function () {
                    return (this.value > 0 ? ' + ' : '') + this.value + '%';
                }"""
            },
            "plotLines": [{
                "value": 0,
                "width": 2,
                "color": 'silver'
            }]
        },
        "plotOptions": {
            "series": {
                "compare": 'percent',
                "showInNavigator": True
            }
        },
    }
    chart = ph.HighStock(object=configuration)
    return chart

returns = pd.Series(np.random.normal(0, 0.01, 1_000),
                    index=pd.date_range("2000-01-01", freq="D", periods=1_000))

dashboard = pn.Column(
    pn.pane.Markdown("## Dashboard"),
    pn.Tabs(
        ("description", pn.pane.Str("blablabla...")),
        ("chart", plot_returns_highcharts(returns)),
        tabs_location="left"
    )
)

dashboard
Here's the output:

The tab chart is displayed properly:
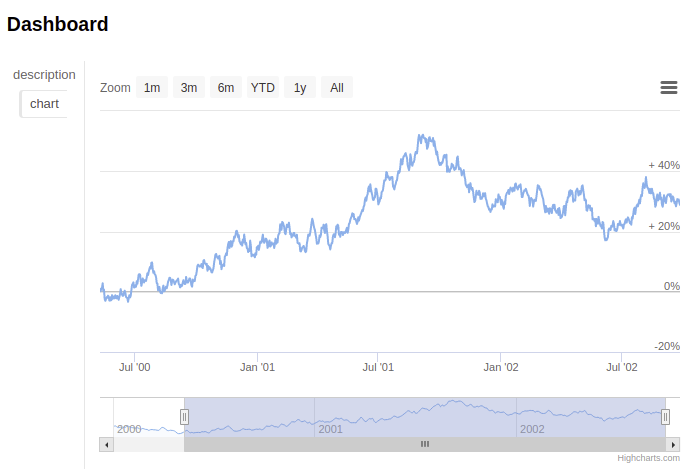
Sorry if it's just a setting I wrongly configured, I spent quite some time on it and couldn't find what's wrong. Thank you!
Make it dead easy to try panel-highcharts. I would like a CLI tool panel-highcharts with the commands
hello which panel serves the example notebooksexamples which copies the example notebooks to /examples/panel-highcharts.Currently there is some friction to try out panel-highcharts. You have to open Binder (slow) or download the notebooks from github. It takes some time and some users might now how to do or understand its possible. You can also git clone the repo. There are 4 commands you have to execute and it might fail.
It would add dependencies like Typer and Rich to the package if we implement it like the awesome-panel-cli.
awesome-panel-cli should enable plugins. So having one cli to collect everything. But I thinkWe should do this in a general way that is consistent with awesome-panel-cli, panel-chemistry etc.
I tried using it. But the chart object does not show up in Google Colab. Is there a fix to this? Since, altair, plotly, bokeh -- all can be shown in colab, can there be something similar for panel-highcharts?
Thank you.
I'm receiving an error when I'm running in panel 0.13. Error message is "TypeError: Read-only parameter 'event' cannot be modified"
When I remove param.Parameterized, it works. @MarcSkovMadsen if you can help me to figure out whether I'm making a mistake or this is a bug, I will be very grateful.
import panel as pn
import param
import polars as pl
import panel_highcharts as ph

pl.Config.set_tbl_cols(12)
pl.Config.set_tbl_rows(20)

ph.config.theme("auto")
pn.extension('highchart',sizing_mode="stretch_width")

class dashboard(param.Parameterized):

    def __init__(self,**params):
        super().__init__(**params)

    def tag_chart(self):
        configuration = {
            "title": {"text": "HighChart Pane"},
            "series": [
                {
                    "name": "series1",
                    "data": [1, 2, 3, 4, 5],
                }
            ]
        }

        return pn.panel(ph.HighChart(object=configuration, sizing_mode="stretch_both", min_height=500))


    def create_layout(self):

        watch_event_layout = pn.Column(pn.Column(self.tag_chart))


        return watch_event_layout

dashboard_object = dashboard().create_layout()
dashboard_object.servable(title='Technical Intelligence Dashboard - Privacy Chains')```
Hello,
The new version of panel (>1.0) provides interesting new tools & syntaxes.
However "panel-highcharts" requires panel < 1.0 (see dependency
panel-highcharts/pyproject.toml
Line 37 in f5a7e13
Thanks in advance,
panel-highcharts is awesome to have JS style & coding with python.
I am developing web tools with python libraries, including holoviz (holoviews, geoviews, panel etc)
Requirements/ lib troubles?
No response
No response
Working in JupyterLab, it appears that a second data series cannot be added to an existing chart.
Example Code showing the problem:
import panel_highcharts as ph

configuration = {
 'title': {'text': 'Stock Chart: UPST'},
 'rangeSelector': {'selected': 1},
 'xAxis': {'type': 'datetime'},
 'series': [{'id': 'pricehistory',
   'name': 'UPST Price History',
   'data': [[1608076800000.0, 29.47],
    [1608163200000.0, 35.77],
    [1608249600000.0, 44.09],
    [1608508800000.0, 41.1],
    [1608595200000.0, 47.84],
    [1608681600000.0, 46.32],
    [1608768000000.0, 43.96],
    [1609113600000.0, 42.63],
    [1609200000000.0, 40.75],
    [1609286400000.0, 38.87],
    [1609372800000.0, 40.75],
    [1609718400000.0, 43.99],
    [1609804800000.0, 48.37],
    [1609891200000.0, 52.14],
    [1609977600000.0, 55.39],
    [1610064000000.0, 52.73],
    [1610323200000.0, 54.71],
    [1610409600000.0, 62.48],
    [1610496000000.0, 57.88],
    [1610582400000.0, 60.64],
    [1610668800000.0, 56.0],
    [1611014400000.0, 54.28],
    [1611100800000.0, 55.22],
    [1611187200000.0, 63.77],
    [1611273600000.0, 64.47],
    [1611532800000.0, 67.36],
    [1611619200000.0, 64.45],
    [1611705600000.0, 64.7],
    [1611792000000.0, 65.15],
    [1611878400000.0, 62.19],
    [1612137600000.0, 70.25],
    [1612224000000.0, 75.47],
    [1612310400000.0, 79.75],
    [1612396800000.0, 75.75],
    [1612483200000.0, 75.24],
    [1612742400000.0, 76.0],
    [1612828800000.0, 80.25],
    [1612915200000.0, 91.04],
    [1613001600000.0, 95.13],
    [1613088000000.0, 102.18],
    [1613433600000.0, 92.28],
    [1613520000000.0, 87.24],
    [1613606400000.0, 82.32],
    [1613692800000.0, 89.73],
    [1613952000000.0, 77.01],
    [1614038400000.0, 73.06],
    [1614124800000.0, 74.51],
    [1614211200000.0, 68.52],
    [1614297600000.0, 65.64],
    [1614556800000.0, 66.65],
    [1614643200000.0, 60.36],
    [1614729600000.0, 57.58],
    [1614816000000.0, 54.92],
    [1614902400000.0, 51.16],
    [1615161600000.0, 46.87],
    [1615248000000.0, 53.24],
    [1615334400000.0, 52.99],
    [1615420800000.0, 59.24],
    [1615507200000.0, 58.0],
    [1615766400000.0, 62.93],
    [1615852800000.0, 60.05],
    [1615939200000.0, 60.79],
    [1616025600000.0, 115.09],
    [1616112000000.0, 125.28],
    [1616371200000.0, 164.87],
    [1616457600000.0, 118.48],
    [1616544000000.0, 112.28],
    [1616630400000.0, 123.73],
    [1616716800000.0, 142.95],
    [1616976000000.0, 134.49],
    [1617062400000.0, 129.28],
    [1617148800000.0, 128.86],
    [1617235200000.0, 144.28],
    [1617580800000.0, 140.52],
    [1617667200000.0, 144.3],
    [1617753600000.0, 126.07],
    [1617840000000.0, 123.33],
    [1617926400000.0, 127.29],
    [1618185600000.0, 112.46],
    [1618272000000.0, 110.46],
    [1618358400000.0, 104.51],
    [1618444800000.0, 110.4],
    [1618531200000.0, 104.65],
    [1618790400000.0, 97.55],
    [1618876800000.0, 91.79],
    [1618963200000.0, 100.61],
    [1619049600000.0, 101.44],
    [1619136000000.0, 107.38],
    [1619395200000.0, 111.24],
    [1619481600000.0, 116.33],
    [1619568000000.0, 113.75],
    [1619654400000.0, 108.56],
    [1619740800000.0, 109.02],
    [1620000000000.0, 114.2],
    [1620086400000.0, 107.36],
    [1620172800000.0, 98.19],
    [1620259200000.0, 92.04],
    [1620345600000.0, 95.97],
    [1620604800000.0, 88.21],
    [1620691200000.0, 89.44],
    [1620777600000.0, 91.82],
    [1620864000000.0, 84.05],
    [1620950400000.0, 103.36],
    [1621209600000.0, 115.0],
    [1621296000000.0, 119.49],
    [1621382400000.0, 132.91],
    [1621468800000.0, 139.08],
    [1621555200000.0, 153.85],
    [1621814400000.0, 139.77],
    [1621900800000.0, 133.7],
    [1621987200000.0, 146.58],
    [1622073600000.0, 166.83],
    [1622160000000.0, 148.22],
    [1622505600000.0, 144.49],
    [1622592000000.0, 157.14],
    [1622678400000.0, 164.83],
    [1622764800000.0, 164.04],
    [1623024000000.0, 170.0],
    [1623110400000.0, 162.01],
    [1623196800000.0, 152.43],
    [1623283200000.0, 146.42],
    [1623369600000.0, 125.505],
    [1623628800000.0, 124.69],
    [1623715200000.0, 123.03]],
   'tooltip': {'valueDecimals': 2}}]
}
chart = ph.HighStock(object=configuration, sizing_mode="stretch_width", height=400)
chart.object_update = {
    'series':chart.object['series'] + [
                {
                    'type':'flags',
                    'onSeries':'pricehistory',
                    'shape':'circlepin',
                    'data':[ {
                        'x': r['Date_BUY'],
                        'title':"BUY",
                        'text':f'BUY UPST {r["Units"]} Shares @ ${r["Value_BUY"]/r["Units"]:.2f}'
                    } for k,r in j.iterrows()
                    ]
                }
    ]
}
In the above chart.object_update code, I can replace the existing series if I do not include the original series. However, that is not the behavior I want. The above code which sets new series data for two data series (the original and flags) leaves the chart unmodified. (side note: it works to create both series at the same time in the original chart, but that is not the behavior I am looking for)
As far as I can determine, there is no other mechanism to dynamically add a data series.
In Javascript, adding a series to a highstock chart is possible using the chart.addSeries({...}); method followed by chart.redraw();
Venn chart is missing in the panel-highcharts package. Please add Venn chart in this package

Got the following error:
Callback failed for object named "Tabs00131" changing property {'active': 1}
Traceback (most recent call last):
  File "C:\Users\qiuch\anaconda3\envs\panel-highcharts\lib\site-packages\panel\reactive.py", line 315, in _process_events
    self.param.update(**self_events)
  File "C:\Users\qiuch\anaconda3\envs\panel-highcharts\lib\site-packages\param\parameterized.py", line 1898, in update
    self_._batch_call_watchers()
  File "C:\Users\qiuch\anaconda3\envs\panel-highcharts\lib\site-packages\param\parameterized.py", line 2059, in _batch_call_watchers
    self_._execute_watcher(watcher, events)
  File "C:\Users\qiuch\anaconda3\envs\panel-highcharts\lib\site-packages\param\parameterized.py", line 2021, in _execute_watcher
    watcher.fn(*args, **kwargs)
  File "C:\Users\qiuch\anaconda3\envs\panel-highcharts\lib\site-packages\panel\layout\tabs.py", line 128, in _update_active
    self.param.trigger('objects')
  File "C:\Users\qiuch\anaconda3\envs\panel-highcharts\lib\site-packages\param\parameterized.py", line 1989, in trigger
    self_.set_param(**dict(params, **triggers))
  File "C:\Users\qiuch\anaconda3\envs\panel-highcharts\lib\site-packages\param\parameterized.py", line 1925, in set_param
    return self_.update(kwargs)
  File "C:\Users\qiuch\anaconda3\envs\panel-highcharts\lib\site-packages\param\parameterized.py", line 1898, in update
    self_._batch_call_watchers()
  File "C:\Users\qiuch\anaconda3\envs\panel-highcharts\lib\site-packages\param\parameterized.py", line 2059, in _batch_call_watchers
    self_._execute_watcher(watcher, events)
  File "C:\Users\qiuch\anaconda3\envs\panel-highcharts\lib\site-packages\param\parameterized.py", line 2021, in _execute_watcher
    watcher.fn(*args, **kwargs)
  File "C:\Users\qiuch\anaconda3\envs\panel-highcharts\lib\site-packages\panel\reactive.py", line 304, in _param_change
    self._apply_update(named_events, msg, model, ref)
  File "C:\Users\qiuch\anaconda3\envs\panel-highcharts\lib\site-packages\panel\reactive.py", line 239, in _apply_update
    self._update_model(events, msg, root, model, doc, comm)
  File "C:\Users\qiuch\anaconda3\envs\panel-highcharts\lib\site-packages\panel\layout\base.py", line 99, in _update_model
    state._views[ref][0]._preprocess(root)
  File "C:\Users\qiuch\anaconda3\envs\panel-highcharts\lib\site-packages\panel\viewable.py", line 500, in _preprocess
    hook(self, root)
  File "C:\Users\qiuch\anaconda3\envs\panel-highcharts\lib\site-packages\panel\links.py", line 247, in _process_callbacks
    cb(root_model, link, src, tgt, arg_overrides=overrides)
  File "C:\Users\qiuch\anaconda3\envs\panel-highcharts\lib\site-packages\panel\links.py", line 342, in __init__
    self._init_callback(root_model, link, source, src_spec, target, tgt_spec, code)
  File "C:\Users\qiuch\anaconda3\envs\panel-highcharts\lib\site-packages\panel\links.py", line 429, in _init_callback
    arg_model = self._resolve_model(root_model, v, None)
  File "C:\Users\qiuch\anaconda3\envs\panel-highcharts\lib\site-packages\panel\links.py", line 387, in _resolve_model
    model, _ = obj._models[root_model.ref['id']]
KeyError: '1008'
2022-08-26 12:28:19,653 Exception in callback functools.partial(<bound method IOLoop._discard_future_result of <tornado.platform.asyncio.AsyncIOMainLoop object at 0x00000287A32D0D30>>, <Task finished name='Task-77' coro=<ServerSession.with_document_locked() done, defined at C:\Users\qiuch\anaconda3\envs\panel-highcharts\lib\site-packages\bokeh\server\session.py:78> exception=KeyError('1008')>)
Traceback (most recent call last):
  File "C:\Users\qiuch\anaconda3\envs\panel-highcharts\lib\site-packages\tornado\ioloop.py", line 741, in _run_callback
    ret = callback()
  File "C:\Users\qiuch\anaconda3\envs\panel-highcharts\lib\site-packages\tornado\ioloop.py", line 765, in _discard_future_result
    future.result()
  File "C:\Users\qiuch\anaconda3\envs\panel-highcharts\lib\site-packages\bokeh\server\session.py", line 99, in _needs_document_lock_wrapper
    result = await result
  File "C:\Users\qiuch\anaconda3\envs\panel-highcharts\lib\site-packages\panel\reactive.py", line 356, in _change_coroutine
    self._change_event(doc)
  File "C:\Users\qiuch\anaconda3\envs\panel-highcharts\lib\site-packages\panel\reactive.py", line 370, in _change_event
    self._process_events(events)
  File "C:\Users\qiuch\anaconda3\envs\panel-highcharts\lib\site-packages\panel\reactive.py", line 315, in _process_events
    self.param.update(**self_events)
  File "C:\Users\qiuch\anaconda3\envs\panel-highcharts\lib\site-packages\param\parameterized.py", line 1898, in update
    self_._batch_call_watchers()
  File "C:\Users\qiuch\anaconda3\envs\panel-highcharts\lib\site-packages\param\parameterized.py", line 2059, in _batch_call_watchers
    self_._execute_watcher(watcher, events)
  File "C:\Users\qiuch\anaconda3\envs\panel-highcharts\lib\site-packages\param\parameterized.py", line 2021, in _execute_watcher
    watcher.fn(*args, **kwargs)
  File "C:\Users\qiuch\anaconda3\envs\panel-highcharts\lib\site-packages\panel\layout\tabs.py", line 128, in _update_active
    self.param.trigger('objects')
  File "C:\Users\qiuch\anaconda3\envs\panel-highcharts\lib\site-packages\param\parameterized.py", line 1989, in trigger
    self_.set_param(**dict(params, **triggers))
  File "C:\Users\qiuch\anaconda3\envs\panel-highcharts\lib\site-packages\param\parameterized.py", line 1925, in set_param
    return self_.update(kwargs)
  File "C:\Users\qiuch\anaconda3\envs\panel-highcharts\lib\site-packages\param\parameterized.py", line 1898, in update
    self_._batch_call_watchers()
  File "C:\Users\qiuch\anaconda3\envs\panel-highcharts\lib\site-packages\param\parameterized.py", line 2059, in _batch_call_watchers
    self_._execute_watcher(watcher, events)
  File "C:\Users\qiuch\anaconda3\envs\panel-highcharts\lib\site-packages\param\parameterized.py", line 2021, in _execute_watcher
    watcher.fn(*args, **kwargs)
  File "C:\Users\qiuch\anaconda3\envs\panel-highcharts\lib\site-packages\panel\reactive.py", line 304, in _param_change
    self._apply_update(named_events, msg, model, ref)
  File "C:\Users\qiuch\anaconda3\envs\panel-highcharts\lib\site-packages\panel\reactive.py", line 239, in _apply_update
    self._update_model(events, msg, root, model, doc, comm)
  File "C:\Users\qiuch\anaconda3\envs\panel-highcharts\lib\site-packages\panel\layout\base.py", line 99, in _update_model
    state._views[ref][0]._preprocess(root)
  File "C:\Users\qiuch\anaconda3\envs\panel-highcharts\lib\site-packages\panel\viewable.py", line 500, in _preprocess
    hook(self, root)
  File "C:\Users\qiuch\anaconda3\envs\panel-highcharts\lib\site-packages\panel\links.py", line 247, in _process_callbacks
    cb(root_model, link, src, tgt, arg_overrides=overrides)
  File "C:\Users\qiuch\anaconda3\envs\panel-highcharts\lib\site-packages\panel\links.py", line 342, in __init__
    self._init_callback(root_model, link, source, src_spec, target, tgt_spec, code)
  File "C:\Users\qiuch\anaconda3\envs\panel-highcharts\lib\site-packages\panel\links.py", line 429, in _init_callback
    arg_model = self._resolve_model(root_model, v, None)
  File "C:\Users\qiuch\anaconda3\envs\panel-highcharts\lib\site-packages\panel\links.py", line 387, in _resolve_model
    model, _ = obj._models[root_model.ref['id']]
KeyError: '1008'
I think it's maybe caused by the download_button.
Thanks!
A declarative, efficient, and flexible JavaScript library for building user interfaces.
🖖 Vue.js is a progressive, incrementally-adoptable JavaScript framework for building UI on the web.
TypeScript is a superset of JavaScript that compiles to clean JavaScript output.
An Open Source Machine Learning Framework for Everyone
The Web framework for perfectionists with deadlines.
A PHP framework for web artisans
Bring data to life with SVG, Canvas and HTML. 📊📈🎉
JavaScript (JS) is a lightweight interpreted programming language with first-class functions.
Some thing interesting about web. New door for the world.
A server is a program made to process requests and deliver data to clients.
Machine learning is a way of modeling and interpreting data that allows a piece of software to respond intelligently.
Some thing interesting about visualization, use data art
Some thing interesting about game, make everyone happy.
We are working to build community through open source technology. NB: members must have two-factor auth.
Open source projects and samples from Microsoft.
Google ❤️ Open Source for everyone.
Alibaba Open Source for everyone
Data-Driven Documents codes.
China tencent open source team.