Git Product home page Git Product logo

anychart / anychart Goto Github PK

View Code? Open in Web Editor NEW
373.0 33.0 60.0 115.46 MB

AnyChart is a lightweight and robust JavaScript charting solution with great API and documentation. The chart types and unique features are numerous, the library works easily with any development stack.

Home Page: https://www.anychart.com/

License: Other

JavaScript 98.71% Shell 0.10% Python 0.70% Less 0.48%
javascript datavis data-visualization charting-library html5-charts charts dashboard chart chartsjs javascript-charts

anychart's Introduction

AnyChart - Robust JavaScript/HTML5 Chart library for any project AnyChart Travis Build AnyChart NPM Version AnyChart Releases AnyChart Download

AnyChart Data Visualization Framework

AnyChart is a flexible JavaScript (HTML5, SVG, VML) charting framework that fits any solution in need of data visualization.

Table of Contents

Download and install

There are several ways to download/install AnyChart.

Direct download

All binaries are located in dist folder.

CDN

If you don't want to download and host AnyChart yourself, you can include it from the AnyChart CDN (Content Delivery Network): https://www.anychart.com/download/cdn

<head>
<script src="https://cdn.anychart.com/releases/v8/js/anychart-base.min.js"></script>
</head>

Package managers

You can install AnyChart using npm, bower or yarn:

  • npm install anychart
  • bower install anychart
  • yarn add anychart

Getting started

The fastest way to start with AnyChart is to include framework into a webpage and write some code. Look at this simple HTML snippet below:

<!doctype html>
<body>
<div id="container" style="width: 500px; height: 400px;"></div>
<script src="https://cdn.anychart.com/releases/v8/js/anychart-base.min.js" type="text/javascript"></script>
<script>
    anychart.onDocumentReady(function() {
        // create a pie chart
        var chart = anychart.pie([
            ["Chocolate", 5],
            ["Rhubarb compote", 2],
            ["Crêpe Suzette", 2],
            ["American blueberry", 2],
            ["Buttermilk", 1]
        ]);
        chart.title("Top 5 pancake fillings");
        // set the container where chart will be drawn
        chart.container("container");
        //  draw the chart on the page
        chart.draw();
    });
</script>
</body>
</html>

Step by step quick start guides

Plugins

AnyChart provides wide variety of plugins for different kind of technologies, which includes:

Using AnyChart with TypeScript

You can use AnyChart in your TypeScript projects - we have definition file for our library which you can find in distribution folder. Please, take a look at webpack and typescript integration example for more details.

Using AnyChart with ECMAScript 6

You can use AnyChart in your ECMAScript 6 projects over two ways:

Plain ECMAScript 6

To add AnyChart on a page use <script> section with type="module" attribute.

<script type="module">
    import '_localpath_to_anychart/anychart-bundle.min.js'
    
    // regular AnyChart code here
</script>

For more details, take a look at AnyChart ES6 example.

Bundling tools and Module Loaders

You can use AnyChart with any bundling tool or module loader such as WebPack, Browserify, Require.js and others. For more details, take a look at AnyChart Webpack example.

Technical Integrations

AnyChart can run on any platform and with any database. These samples were created to demonstrate how AnyChart can be easily integrated into your environment. All examples are distributed under an Apache 2.0 License and can be customized to your application. If you are interested in a particular integration not listed here, please contact us.

ASP.NET, C# and MySQL ASP.NET, VB.NET and MySQL ASP.NET, C#, SignalR and MySQL
Go, Revel and MySQL Go and MySQL Java Servlets, Maven, JDBC, JSP and MySQL
NodeJS and MongoDB using socket.io Java Spring, Maven, Hibernate and MySQL Julia and MySQL
NodeJS Express, Jade and MongoDB PHP, Symfony and MySQL PHP, Laravel and MySQL
PHP, Slim and MySQL Perl, Catalyst Web Framework and MySQL Python, Flask and MySQL
Python, Django and MySQL R, Shiny and MySQL Ruby, Sinatra and MySQL
Ruby on Rails and MySQL Scala, Akka and MySQL Scala, Play and MySQL

Contribution guide

To contribute to AnyChart project please:

  • Fork AnyChart repository.
  • Create a branch from the develop branch.
  • Make any changes you want to contribute.
  • Create a pull request against the develop branch.

GitHub documentation: Forking repositories.
GitHub documentation: Collaborating using pull requests.

Please, note:

  1. AnyChart bears no responsibility for the code written by third-party developers until pull request is accepted.
  2. After pull request is accepted the author of pull request sign over all rights to the code to AnyChart.

Build and debug

Dependencies

AnyChart uses several third-party libraries and tools to work with JavaScript and CSS.

Building options

build.py python script is used to work with AnyChart project. You need to install python to use it.

To see all available options of the build script use -h or --help command:

./build.py -h.

To see command options use:

./build.py <command_name> -h

To install all dependencies use the deps command:

./build.py deps.

After running this command you can compile the project using the compile command:

./build.py compile

This compiles production version of anychart-bundle and all modules and puts them into the out folder. You can read more about modules in our Modules article.

To create a dev build for the debug purposes use -d or --develop option:

./build.py compile -d

The -df option generates property renaming report, variable renaming report, and source map location mapping files:

./build.py compile -df

Source map maps minified code to source code. Read more about using source maps in Chrome or source maps in Firefox.

Module system

AnyChart since v8.0.0 is structured as a modules, so you can use only what you need. Please look at our article Modules to start working with modules.

Package directory

├── css
│   ├── anychart.less
│   ...
├── dist
│   ├── json-schema.json
│   ├── xml-schema.xsd
│       ...
├── src
│   ├── charts
│   ├── core
│   ├── modules
│   ├── themes
│       ...
│   README.md
│   LICENSE
│   ...

css

The css folder contains .less CSS files that are compiled into one .css file.

src

The src folder contains AnyChart source code files organized according to the project structure. For example:

  • charts subfolder contains chart classes
  • core subfolder contains core classes
  • modules subfolder contains modules
  • themes contains themes

dist

The dist folder contains binaries and JSON/XML Schemas.

Contacts

Links

License

© AnyChart.com - JavaScript charts. All rights reserved.

anychart's People

Contributors

antonbaranchuk avatar anychart-vitaly avatar archangel-irk avatar avezhenya avatar batsuev avatar blackart avatar chernetsky avatar chidori avatar grasshoppergn avatar irkutsk-anychart avatar kardiogram avatar kianawind avatar loki20beta avatar nymphly avatar romanlubushkin avatar

Stargazers

 avatar  avatar  avatar  avatar  avatar  avatar  avatar  avatar  avatar  avatar  avatar  avatar  avatar  avatar  avatar  avatar  avatar  avatar  avatar  avatar  avatar  avatar  avatar  avatar  avatar  avatar  avatar  avatar  avatar  avatar  avatar  avatar  avatar  avatar  avatar  avatar  avatar  avatar  avatar  avatar  avatar  avatar  avatar  avatar  avatar  avatar  avatar  avatar  avatar  avatar  avatar  avatar  avatar  avatar  avatar  avatar  avatar  avatar  avatar  avatar  avatar  avatar  avatar  avatar  avatar  avatar  avatar  avatar  avatar  avatar  avatar  avatar  avatar  avatar  avatar  avatar  avatar  avatar  avatar  avatar  avatar  avatar  avatar  avatar  avatar  avatar  avatar  avatar  avatar  avatar  avatar  avatar  avatar  avatar  avatar  avatar  avatar  avatar  avatar  avatar

Watchers

 avatar  avatar  avatar  avatar  avatar  avatar  avatar  avatar  avatar  avatar  avatar  avatar  avatar  avatar  avatar  avatar  avatar  avatar  avatar  avatar  avatar  avatar  avatar  avatar  avatar  avatar  avatar  avatar  avatar  avatar  avatar  avatar  avatar

anychart's Issues

Comma-separated values not possible with 'groupsSeparator' formatting logic

I noticed this recently while trying to add commas to the y-scale values for a bar chart.

GroupsSeparator works fine for any other value, except commas, which would seem to be a common use case. I've tried to put it inside quotes, and tried escaping it, encoding it, etc. Nothing seems to work.

I can wrote custom formatting logic, but since you have the ability to separate on other characters, I'm curious why you can't separate on a comma.

This is even evident in your text formatting playground item (shown in this fiddle: https://jsfiddle.net/eh4yu59n/ ).

Is this something that is painfully obvious to others and I'm just missing something, or is this a bug? Thanks.

BUG: Falls tab of the memory leak

Falls tab if between the values of the scale Y of the difference y 0.00001
Падает вкладка, если между значениями в шкале Y разница 0,00001

<!doctype html>
<html>
  <head>
    <script src="https://cdn.anychart.com/js/7.13.0/anychart-bundle.min.js"></script>
    <link rel="stylesheet" href="https://cdn.anychart.com/css/7.13.0/anychart-ui.min.css" />
    <style>
      html, body, #container {
        width: 100%;
        height: 100%;
        margin: 0;
        padding: 0;
      }
    </style>
  </head>
  <body>
    <div id="container"></div>
    <script>

anychart.onDocumentReady(function() {
    chart = anychart.line([1.10001, 1.10002]);

    chart.container("container");
    chart.draw();
});
    
    </script>
  </body>
</html>

Issue in radar area chart

The 'y' labels are positioned incorrectly. That, or the area charts are drawn incorrectly. This doesn't happen in a line radar chart.

Check out this jsfiddle.
If you look at 'Series 3', the value in 'A' is '3', but the label on the axis it's on is '6'.

This is also existing in the sample code in your documentation for radar chart.

Set filename per chart

An option to set the filename for the chart instance would be handy instead of it being applied to everything which in many cases is not ideal.

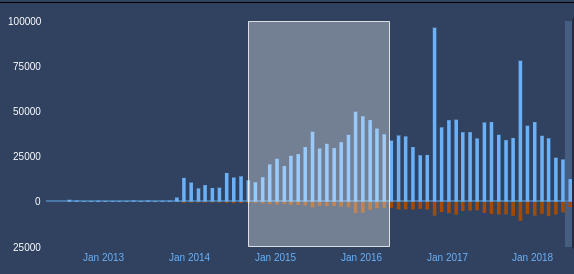
Filter on drawing selection box

I need to filter data according to selection range on rectangle drawing, like on this graphic:

screenshot

It would be a functionality similar to range selection, but not restricted to stock chart (at least enabled in column chart)

Is that already an existing feature or possibly in future updates? Couldn't find anything related on documentation

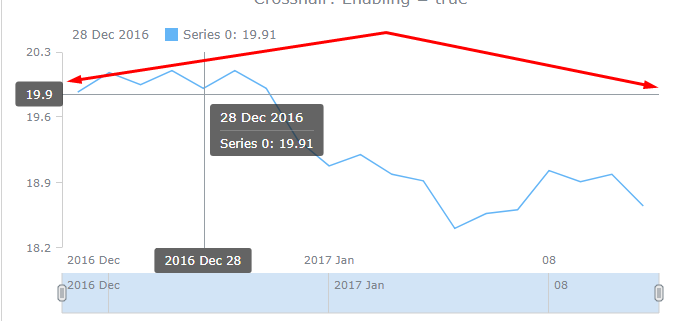
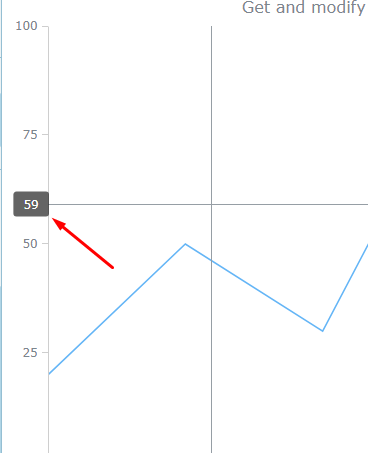
Price marker

Is it possible to make such markers in a simple way?

Now i have to do the line separately, and the container with the price to do next to the chart is a simple div and calculate its position
(Сейчас приходиться делать линию отдельно, а контейнер с ценой делать рядом с графиком простым див и вычислять его положение)

markers

How to change size of circles in legend

I was wondering if it's possible to change the size of the legend circles through code or css, i did not find anything in the documentations that led me to believe is possible, any confirmations?

Browser Crash

The following HTML code generates a browser crash. Any ideas?

<!doctype html>
<head>
    <script src="https://cdn.anychart.com/releases/8.1.0/js/anychart-bundle.min.js"></script>
    <link rel="stylesheet" href="https://cdn.anychart.com/releases/8.1.0/css/anychart-ui.min.css"/>
    <link rel="stylesheet" href="https://cdn.anychart.com/releases/8.1.0/fonts/css/anychart-font.min.css"/>

    <style>
        html, body, #container {
            width: 100%;
            height: 100%;
            margin: 0;
            padding: 0;
        }
    </style>
</head>

<body>
<div id="container"></div>
</body>

<script>
    window.charting = {
        chart: anychart.stock(),
        dataTable: anychart.data.table()
    };

    window.charting.mapping = window.charting.dataTable.mapAs({
        'value': 1
    });

    window.charting.plot0 = window.charting.chart.plot(0);

    //Create series
    window.charting.series = window.charting.plot0.line(window.charting.mapping);

    //Set container and draw chart
    window.charting.chart.container('container');
    window.charting.chart.draw();

    //Set chart title
    window.charting.chart.title('Test Chart');

    window.charting.dataTable.addData([[1515698475780, 0.08826999]]);
    window.charting.dataTable.addData([[1515698479873, 0.08826998]]);
</script>

v8.2.0 - compile error DataGridButton anychart.core.ui

I've just upgraded to v8.2.0 from v8.1.0 and I am seeing this compile error.

ERROR in node_modules/anychart/dist/index.d.ts(30337,55): error TS2694: Namespace 'anychart.core.ui' has no exported member 'DataGridButton'.

Setting to disable sharing functionality

Add an option to disable sharing as in many corporate environments you don't want data being shared as it presents a risk to the privacy and security of that data.

Themes references "blendedHueProgression" of anychart color object

Hi guys. I am trying to setup your awesome chart modules here, and have encountered something a bit strange. While trying to setup the most simple tag cloud chart i run into this error:

TypeError: Cannot read property 'blendedHueProgression' of undefined

The error stems from using both the darkEarth and darkTurquise theme downloaded from the official anychart site. It points to this function in the themes:

defaultOrdinalColorScale: { autoColors: function(a) { return b.anychart.color.blendedHueProgression("#b2dfdb", "#00838f", a) } }

Which it here claims that .color is undefined.

dark_turquoise.js:23:41 /node_modules/anychart/dist/js/anychart-bundle.min.js:1927:444

There is no special configuration being used just the very most basic setup:

var chart = anychart.tagCloud(data); chart.container('container'); chart.draw();

Where data is a short list structured after the documentations example of [{ x: "title", value: 4 }]

Any thoughts on how to further debug this issue ?

Color Holidays in Resource Calendar

Hi Guys,

is there any possibility to color specific days in the calendar?

I'm currently using this code:

            // create resource gantt chart
            chart = anychart.resource();
            chart.zoomLevel(2);
            chart.container('times_holidays_gantt');

            var resourceList = chart.resourceList();
            var names = resourceList.names();
            // Set font size.
            names.fontSize(14);

            // get chart data grid link to set column settings
            chart.tooltip().useHtml(true);
            chart.tooltip().textFormatter(function (e) {
                var item = e['activity'];
                return 'Von: ' + anychart.format.dateTime(e['activity']['start'], 'dd.MM.yyyy', -60, "de-de") + '  Uhr<br>'
                     + 'Bis: ' + anychart.format.dateTime(e['activity']['end'], 'dd.MM.yyyy', -60, "de-de") + ' Uhr';
            });

            chart.tooltip().titleFormatter(function (e) {
                return e['activity']['name'] + 'ag(e) ' + e['activity']['reason'];
            });


            anychart.format.outputLocale("de-de");
            anychart.format.outputTimezone(-120);

            chart.data(data);

            chart.draw();

When data is added, the scroll starts to shift.

This is very inconvenient when creating live charts, for example, a quotation chart.
This is because the scroll is tied to dates. To avoid this, you have to use the 'selectRange'.
Can this be avoided and how to make a normal zoom without reference to the date?

bug
bug2

listen interface missing the event parameter

When using TypeScript and the definitions, this causes an error:

const chart = anychart.stock();
chart.listen('selectedrangechangefinish', (event) => {});

Because the definitions states the function does not take any arguments, event though this one has an event . Could you add it?

Error Syncing Gradle

Failed to resolve: com.github.AnyChart:AnyChart-Android:0.3.0

Below is a copy of the module build.gradle file

apply plugin: 'com.android.application'

android {
compileSdkVersion 26
defaultConfig {
applicationId "com.calculators.charts"
minSdkVersion 17
targetSdkVersion 26
versionCode 1
versionName "1.0"
testInstrumentationRunner "android.support.test.runner.AndroidJUnitRunner"
}
buildTypes {
release {
minifyEnabled false
proguardFiles getDefaultProguardFile('proguard-android.txt'), 'proguard-rules.pro'
}
}
}

dependencies {
implementation fileTree(dir: 'libs', include: ['*.jar'])
implementation 'com.android.support:appcompat-v7:26.1.0'
implementation 'com.android.support.constraint:constraint-layout:1.1.2'
testImplementation 'junit:junit:4.12'
androidTestImplementation 'com.android.support.test:runner:1.0.2'
androidTestImplementation 'com.android.support.test.espresso:espresso-core:3.0.2'
implementation 'com.github.AnyChart:AnyChart-Android:0.3.0'
}

HTML formatting of tooltips doesn't allow newlines

I'm trying to do something hacky since I don't have full access to rendering custom HTML for the tooltips.

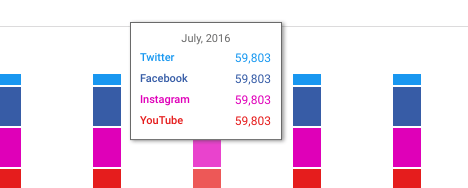
On a multi-series, stacked bar chart, I'm attempting to take all the series items in a union'd tooltip, and color them independently. Unfortunately, useHtml and format() don't actually give you the flexibility to write custom HTML, only to add flavoring to it.

For instance:

const chart.tooltip();
tooltip.format(function () {
     const hexFill = this.b.Zg.fe.data.fill || '#000000'; // Really wish this was more accessible :)

     return `\n<div style="color:${hexFill};">${this.seriesName}: ${this.value}</div>\n`;
});

This colors them appropriately, but since it converts any HTML to a <tspan fill="#000000"> it doesn't actually take into account that I want them broken on separate lines.

I've attempted to the the same with a unionFormat() function, reducing all of the point values into one string with a bunch of '\n', to no avail. Escaping the newline doesn't help either.

Am I missing something, or is this flexibility not possible?

Actual:
image

Expected:
image

Also, curious, are dropshadows going to be implemented on tooltips anytime in the future?

Thanks!

Vertical Line xAnchor

const date = new Date();
date.setUTCHours(4, 0, 0, 0);
controller.verticalLine({
xAnchor: date
}).stroke({color: '#546e7a', thickness: 0.5, dash: 5});

Добавляю вертикальную линию на 4 часа UTC, ожидаю ее увидеть в 7 часов утра (UTC+3), а она всегда показывается в 4 утра в любом часовом поясе.

KDJJ calculation is incorrect

In the graphic, the KDJJ shows a +, this is incorrect and should be a -.

Edit: In fact, the whole of KDJ is misleading. There's no mention of RSV, and that KDJK is a 3 point moving average of it, thus meaning the calculations KDJD and KDJJ will be incorrect.

TypeScript Definition File

We're trying out AnyChart in our TypeScript project but we're having trouble getting code hinting working. Is there any special setup required to use the packaged TypeScript Definition file?

We currently import the module as"
import * as anychart from 'anychart';

but when we go to use "anychart" in the code, no code hinting occurs.

Thanks for any help!
Matt

Error when requiring the library

Thank you guys for this awesome library,

When I use the link from the cdn it works perfectly, but when requiring it it shows an error:
I try this code in : https://npm.runkit.com/anychart

var anychart = require("anychart")

anychart.onDocumentReady(function() {
  var chart = anychart.pie([10, 20, 7, 18, 30]);
  console.log('done');
});

It shows this error: TypeError: anychart.onDocumentReady is not a function

I have no idea what is the problem.

Date.UTC($YR, $MO, $DY) is ahead by 1 month in Hover Over & Axis

https://playground.anychart.com/docs/8.2.1/samples/BCT_Japanese-Candlestick_Chart_01

 var data = [
      [Date.UTC(2007, 07, 23), 23.55, 23.88, 23.38, 23.62],
      [Date.UTC(2007, 07, 24), 22.65, 23.7, 22.65, 23.36],
      [Date.UTC(2007, 07, 25), 22.75, 23.7, 22.69, 23.44],
      [Date.UTC(2007, 07, 26), 23.2, 23.39, 22.87, 22.92],
      [Date.UTC(2007, 07, 27), 23.98, 24.49, 23.47, 23.49],
      [Date.UTC(2007, 07, 30), 23.55, 23.88, 23.38, 23.62],
      [Date.UTC(2007, 07, 31), 23.88, 23.93, 23.24, 23.25],
      [Date.UTC(2007, 08, 01), 23.17, 23.4, 22.85, 23.25],
      [Date.UTC(2007, 08, 02), 22.65, 23.7, 22.65, 23.36],
      [Date.UTC(2007, 08, 03), 23.2, 23.39, 22.87, 22.92],
      [Date.UTC(2007, 08, 06), 23.03, 23.15, 22.44, 22.97],
      [Date.UTC(2007, 08, 07), 22.75, 23.7, 22.69, 23.44]
    ];

For whatever reason the chart is drawing 1 month ahead. As you can see from your own example/sample, hover over the first value and you can see it says Aug 23, not July 23, this is true for any data sample.

cannot create line gauge chart

There is an error when i try to create line gauge chart

Uncaught TypeError: a.split is not a function
at Object.$.H (anychart-base.min.js:18)
at anychart-linear-gauge.min.js:14
at anychart-linear-gauge.min.js:43
at anychart-linear-gauge.min.js:10

ANDROID - Regarding polar chart !

Hi,

i have seen your library and i want to use polar chart , i want to make a polar chart like below in screenshot , can i customize your polar chart as y0u can see in the screenshot.

  1. can i set the random color for each arc in the circle as now all in blue color ?.
  2. progress of a particular section in percentage - as you can see in the image below , like if i have 40 % then my arc will be filled 40% .
    brush- 1

AnyChart has incompatibilities with postss-loader autoprefixer

Anychart css make angular-cli build show annoying warnings:

WARNING in ./node_modules/css-loader?{"sourceMap":false,"import":false}!./node_modules/postcss-loader/lib?{"ident":"postcss","sourceMap":false}!./node_modules/anychart/dist/css/anychart-ui.min.css
(Emitted value instead of an instance of Error) autoprefixer: 
/Users/computer/Documents/base/base-one/node_modules/anychart/dist/css/anychart-ui.min.css:1:10719: Gradient has outdated direction syntax.
 New syntax is like `to left` instead of `right`.

very small number values

Dear Anychart support
I am having the next issue (with anystock)
https://stackoverflow.com/questions/48918872/very-small-number-values-in-anychart-cause-graph-to-crash-oom

some news?

in anychart 8.0.1 and 8.0.0 it works but in the newest versions it donts.
I try
anychart.format.locales.default.numberLocale.decimalsCount = 16;
anychart.format.locales.default.numberLocale.scale = true

or passing the number in scientific notation
var num = 0.0000000000556789;
var n = num.toExponential();

but it dont works.
some temporal solution?

thanks for your help.

Best Reagards,
Omar.

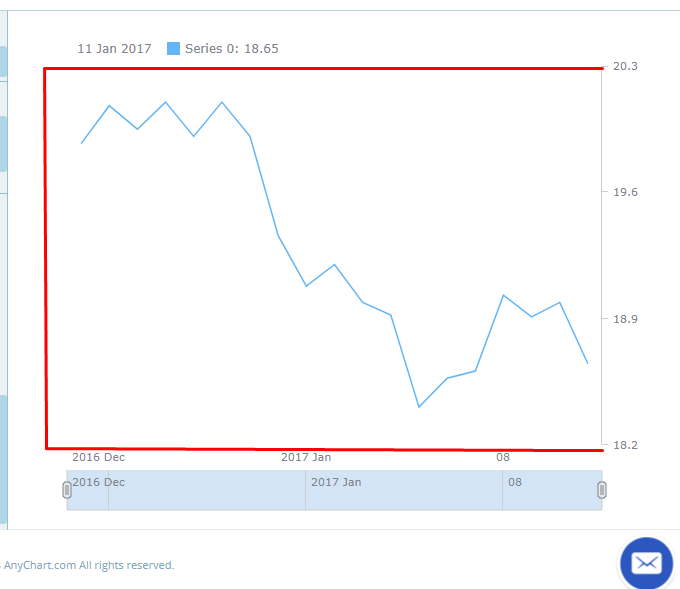
Right indent in the stock chart

How to make the indentation at the right side of the chart?
It is very necessary to analyze the financial charts, the indicators used and the line
Как сделать отступ справа у графика?
Это очень необходимо для анализа финансовых графиков, когда используются индикаторы и линии
indent

Loading JSON File error

i'm starting trying anyChart Demo version , I'd like to use the load jsonfile mode and i have followed the steps in the documentation https://docs.anychart.com/Working_with_Data/Data_Adapter/Loading_JSON_File but getting this error:
anychart-data-adapter.min.js:14 Uncaught TypeError: $.JQ is not a function
at Object.loadXmlFile (anychart-data-adapter.min.js:14)
at pruebagrafica.php:41
(anonymous) @ anychart-data-adapter.min.js:14
Could you please help me to resolve this?
do I missing something?
this is my html code:

<html>
    <head>
        <meta charset="UTF-8">
        <title></title>
          <script src="../anychart8.2.1/js/anychart-base.min.js" type="text/javascript"></script>
          <script src="../anychart8.2.1/js/anychart-data-adapter.min.js"></script>
          <script type="text/javascript">

anychart.data.loadJsonFile("https://cdn.anychart.com/charts-data/data_json.json", function (data) {
	// create a chart and set loaded data
    chart = anychart.bar(data);

    chart.title("Load JSON data and create a chart");
    chart.container("container");
    chart.draw();
});

 </script>

    </head>

<body>
       <div id="container" style="width: 500px; height: 400px;"></div>
</body>
</html>

Thanks in advance
Marisol

Configure labels individually

Is there a way to configure labels individually?

I wanted to do something like this:

var labels = chart.xAxis().labels();
labels.getLabel(0).background('#f00');

I see that there is a getLabel method on anychart.core.ui.LabelsFactory.prototype, but somehow that's not available in labels.

Error in type defs?

The following code is giving me type errors using the bundled definitions. I'm attempting to assemble a mixed series (column + line) chart with a dashed line.

let usage = anychart.data.set(data['usage']).mapAs({
            x: 0,
            value: 1
        })

        let license = anychart.data.set(data['license']).mapAs({
            x: 0,
            value: 1
        })

        let chart = anychart.column();
        chart.animation(true);
        chart.title('Mixed Line / Column chart of usage and license')
        chart.column(usage);

        let licenseLine = chart.line(license)
        licenseLine.name('APM License')
        licenseLine.size(4)
        licenseLine.stroke({
            color: '#6C6C6C',
            dash: '3 5 10 5'
        })

Everything from licenseLine.size(4) has the red squiggly with the messageProperty size does not exist on type Line.

In this case, the chart.line() constructor returns an anychart.core.cartesian.series.Line which doesn't appear to have a size property.

I had tried method chaining too - but the licenseLine.name('') call returns a anychart.core.SeriesBase which also doesn't expose a size property. Same for stroke.

Is this incorrect, or is there a way I can force an appropriate type here?

Jump to a specific Date

Hey Guys,

im using the following script and it is working perfect, but my customer wants me to implement that it jumps to a specific date in the calendar when it is loaded. (For example the actual Day)

How can i implement it? Didn't find a solution in the docs or api.

Thanks for your help.

Best regards
Max

            chart = anychart.resource();
            chart.zoomLevel(2);
            chart.container('times_holidays_gantt');

            var resourceList = chart.resourceList();
            var names = resourceList.names();
            // Set font size.
            names.fontSize(14);

            // get chart data grid link to set column settings
            chart.tooltip().useHtml(true);
            chart.tooltip().textFormatter(function (e) {
                var item = e['activity'];
                return 'Von: ' + anychart.format.dateTime(e['activity']['start'], 'dd.MM.yyyy', -60, "de-de") + '  Uhr<br>'
                     + 'Bis: ' + anychart.format.dateTime(e['activity']['end'], 'dd.MM.yyyy', -60, "de-de") + ' Uhr';
            });

            chart.tooltip().titleFormatter(function (e) {
                return e['activity']['name'] + 'ag(e) ' + e['activity']['reason'];
            });


            anychart.format.outputLocale("de-de");
            anychart.format.outputTimezone(-120);

            // create data tree on raw data
            chart.data(data);

            chart.draw();

Memory issue on a SPA

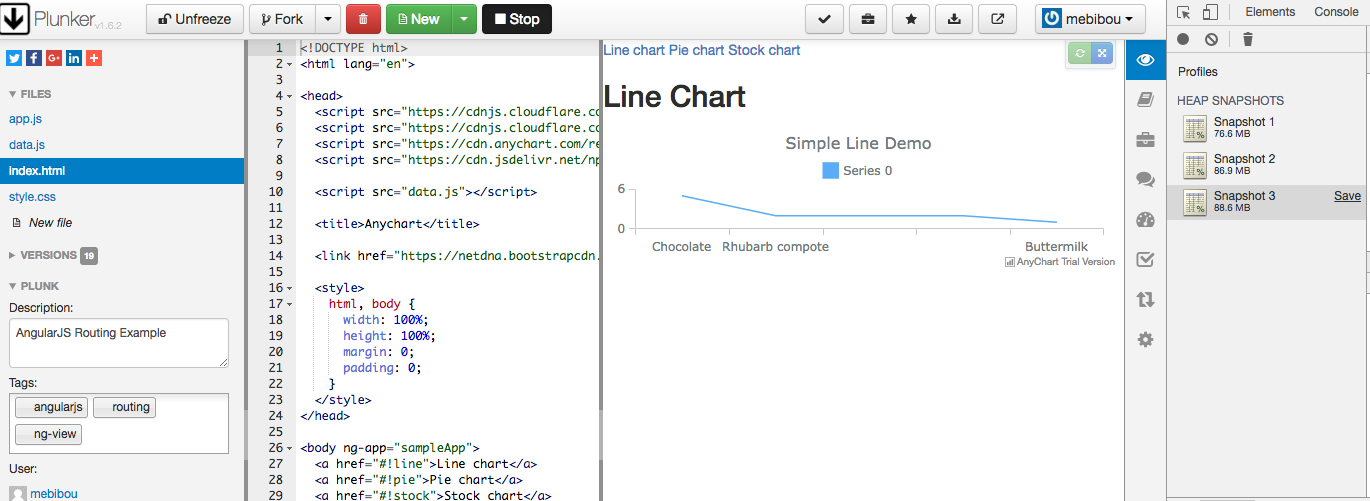
I am not sure if it has to do with how we are using anychart in our AngularJS project, but we're experiencing memory leaks on pages where we have some charts displayed. I've created a simple plunkr using angular route and a few charts: https://plnkr.co/edit/tKhqlu?p=preview

If I load the page, then open the stock chart, then go back to the pie chart, and taking heap snapshots on Chrome dev tool along the way, I can see that the memory increases on the stock chart but does not get released on the Pie chart after going back.

screen shot 2018-04-04 at 1 56 13 pm

From this screenshot, what I did:

  1. Open the page, then "Take heap snapshot" > Snapshot 1
  2. Click on "Stock chart", then "Take heap snapshot" > Snapshot 2
  3. Click on "Pie chart", then "Take heap snapshot" > Snapshot 3

Normally Snapshot 3 should be at 76.6Mb again I think, but somehow it remains more than on Snapshot 2. Is there some function to be called on the chart to cleanly destroy it?

Cannot create Circular Gauge chart in Angular 6

Hi,

with different charts from anychart, anything is working properly, but
when I try to use the circular Gauge chart, it doesnt show me anything.
Even the component holding the chart just shows me the div element of the chart,
but without any chart data or drawing.

I used several examples from the anychart gallery and the quick start guide:
[(https://docs.anychart.com/Gauges/Quick_Start)]

I installed anychart 8.3 via npm install. Any other chart than CircularGauge is working.
I dont see what the difference between the gauge chart and the other charts is.

Best regards,

Sagat

Got the error when running example with node module

_I run the example code
"
// require file system and jsdom
var fs = require('fs')
var jsdom = require('jsdom').jsdom

// create default jsdom view
var d = jsdom('

')
var w = d.defaultView

// require anychart and anychart export modules
var anychart = require('anychart')(w)
var anychartExport = require('anychart-nodejs')(anychart)

// create and a chart to the jsdom defaultView
var chart = anychart.pie([10, 20, 7, 18, 30])
chart.container('container')
chart.bounds(0, 0, 800, 600)
chart.draw()

// generate JPG image and save it to a file
anychartExport.exportTo(chart, 'jpg').then(function (image) {
fs.writeFile('anychart.jpg', image, function (fsWriteError) {
if (fsWriteError) {
console.log(fsWriteError.message)
} else {
console.log('Complete')
}
process.exit(0)
})
}, function (generationError) {
console.log(generationError.message)
process.exit(1)
})_"
and got the exception "
ypeError: this.bh.getBBox is not a function
at ej.$.g.measure (/Users/sangshh/ProjectSrcCode/json-to-chart/node_modules/anychart/dist/anychart-bundle.min.js:704:400)
at Oh (/Users/sangshh/ProjectSrcCode/json-to-chart/node_modules/anychart/dist/anychart-bundle.min.js:118:486)
at $.g.gj (/Users/sangshh/ProjectSrcCode/json-to-chart/node_modules/anychart/dist/anychart-bundle.min.js:688:371)
at ei (/Users/sangshh/ProjectSrcCode/json-to-chart/node_modules/anychart/dist/anychart-bundle.min.js:132:210)
at $.g.iu (/Users/sangshh/ProjectSrcCode/json-to-chart/node_modules/anychart/dist/anychart-bundle.min.js:696:48)
at $.g.Wn (/Users/sangshh/ProjectSrcCode/json-to-chart/node_modules/anychart/dist/anychart-bundle.min.js:686:34)
at $.g.wb (/Users/sangshh/ProjectSrcCode/json-to-chart/node_modules/anychart/dist/anychart-bundle.min.js:612:125)
at Vs (/Users/sangshh/ProjectSrcCode/json-to-chart/node_modules/anychart/dist/anychart-bundle.min.js:370:39)
at Ms.$.g.fb (/Users/sangshh/ProjectSrcCode/json-to-chart/node_modules/anychart/dist/anychart-bundle.min.js:994:123)"

Chaining functions does not work as expected using definitions

I was using anychart in TypeScript before and didn't realize there were definitions in the anychart dist folder because they are not being picked up automatically like other libraries do (that's not the bug I report here though). Now that I added the definitions, I am getting many errors when I do something like:

export class Test {
  private chart: anychart.charts.CircularGauge;

  init() {
    this.chart.stroke(null).padding(0).margin(5).startAngle(270).sweepAngle(180);
  }
}

which gives the error: Property 'startAngle' does not exist on type 'Chart', even though this definitely works.

The reason is because the definition of margin is:

margin(value: ...): anychart.chart.Core;

when it should be something like:

margin<T>(value: ...): T;

which will just give you the type of the component asking for it. Actually, I'm a bit puzzled of the definition file and how complicated it looks (and make my Atom so slow because of the huge amount of definitions in there, which a lot of them are duplicated it seems)

I'm using version 8.2.0-preview-0103

Height always 100%

Hi Guys,

i'm using the following code to implement Anychart, but i always have to give a height to the div container. How can i set it to always 100% of the Chart, so that a vertical scrollbar is not needed?

HTML

<div id="times_holidays_gantt" class="gantt-container" style="width: 100%;height: 1100px;"></div>
            // create resource gantt chart
            chart = anychart.resource();
            chart.zoomLevel(2);
            chart.container('times_holidays_gantt');

          
            var resourceList = chart.resourceList();
            var names = resourceList.names();
            // Set font size.
            names.fontSize(14);

            // get chart data grid link to set column settings
            chart.tooltip().useHtml(true);
            chart.tooltip().textFormatter(function (e) {
                var item = e['activity'];
                return 'Von: ' + anychart.format.dateTime(e['activity']['start'], 'dd.MM.yyyy', -60, "de-de") + '  Uhr<br>'
                     + 'Bis: ' + anychart.format.dateTime(e['activity']['end'], 'dd.MM.yyyy', -60, "de-de") + ' Uhr';
            });

            chart.tooltip().titleFormatter(function (e) {
                return e['activity']['name'] + 'ag(e) ' + e['activity']['reason'];
            });


            anychart.format.outputLocale("de-de");
            anychart.format.outputTimezone(-120);

            chart.data(data);

            chart.draw();

Icons are missing

The CSS and JavaScript references to the existence of icons mainly for the context menu but the font files needed are not included in this repository.

Recommend Projects

  • React photo React

    A declarative, efficient, and flexible JavaScript library for building user interfaces.

  • Vue.js photo Vue.js

    🖖 Vue.js is a progressive, incrementally-adoptable JavaScript framework for building UI on the web.

  • Typescript photo Typescript

    TypeScript is a superset of JavaScript that compiles to clean JavaScript output.

  • TensorFlow photo TensorFlow

    An Open Source Machine Learning Framework for Everyone

  • Django photo Django

    The Web framework for perfectionists with deadlines.

  • D3 photo D3

    Bring data to life with SVG, Canvas and HTML. 📊📈🎉

Recommend Topics

  • javascript

    JavaScript (JS) is a lightweight interpreted programming language with first-class functions.

  • web

    Some thing interesting about web. New door for the world.

  • server

    A server is a program made to process requests and deliver data to clients.

  • Machine learning

    Machine learning is a way of modeling and interpreting data that allows a piece of software to respond intelligently.

  • Game

    Some thing interesting about game, make everyone happy.

Recommend Org

  • Facebook photo Facebook

    We are working to build community through open source technology. NB: members must have two-factor auth.

  • Microsoft photo Microsoft

    Open source projects and samples from Microsoft.

  • Google photo Google

    Google ❤️ Open Source for everyone.

  • D3 photo D3

    Data-Driven Documents codes.