Git Product home page Git Product logo

mplcursors's Introduction

Interactive data selection cursors for Matplotlib


mplcursors provides interactive data selection cursors for Matplotlib. It is inspired from mpldatacursor, with a much simplified API.

mplcursors requires Matplotlib≥3.1.

Read the documentation on readthedocs.org.

As usual, install using pip:

$ pip install mplcursors  # from PyPI
$ pip install git+https://github.com/anntzer/mplcursors  # from Github

or your favorite package manager.

Run tests with pytest.

mplcursors's People

Contributors

anntzer avatar davidgilbertson avatar qulogic avatar

Stargazers

 avatar  avatar  avatar  avatar  avatar  avatar  avatar  avatar  avatar  avatar  avatar  avatar  avatar  avatar  avatar  avatar  avatar  avatar  avatar  avatar  avatar  avatar  avatar  avatar  avatar  avatar  avatar  avatar  avatar  avatar  avatar  avatar  avatar  avatar  avatar  avatar  avatar  avatar  avatar  avatar  avatar  avatar  avatar  avatar  avatar  avatar  avatar  avatar  avatar  avatar  avatar  avatar  avatar  avatar  avatar  avatar  avatar  avatar  avatar  avatar  avatar  avatar  avatar  avatar  avatar  avatar  avatar  avatar  avatar  avatar  avatar  avatar  avatar  avatar  avatar  avatar  avatar  avatar  avatar  avatar  avatar  avatar  avatar  avatar  avatar  avatar  avatar  avatar  avatar  avatar  avatar  avatar  avatar  avatar  avatar  avatar  avatar  avatar  avatar  avatar

Watchers

 avatar  avatar  avatar  avatar  avatar  avatar  avatar  avatar  avatar

mplcursors's Issues

mplcursors with pcolormesh fails

mplcursors seems to work fine with contourf function, but fails with pcolormesh. Any idea? See below for example:

  1. works
import numpy as np
import matplotlib.pyplot as plt
import mplcursors

np.random.seed(42)

fig, ax = plt.subplots()
cf = ax.contour(np.random.random((10, 10)))
cursor = mplcursors.cursor()

@cursor.connect("add")
def on_add(sel):
    ann = sel.annotation
    # `cf.collections.index(sel.artist)` is the index of the selected line
    # among all those that form the contour plot.
    # `cf.cvalues[...]` is the corresponding value.
    ann.set_text("{}\nz={:.3g}".format(
        ann.get_text(), cf.cvalues[cf.collections.index(sel.artist)]))

plt.show()
  1. Does not work, returns error message:

UserWarning: Pick support for QuadMesh is missing.
warnings.warn(f"Pick support for {type(artist).name} is missing.")

import numpy as np
import matplotlib.pyplot as plt
import mplcursors

np.random.seed(42)

fig, ax = plt.subplots()
cf = ax.pcolormesh(np.random.random((10, 10)))
cursor = mplcursors.cursor()

@cursor.connect("add")
def on_add(sel):
    ann = sel.annotation
    # `cf.collections.index(sel.artist)` is the index of the selected line
    # among all those that form the contour plot.
    # `cf.cvalues[...]` is the corresponding value.
    ann.set_text("{}\nz={:.3g}".format(
        ann.get_text(), cf.cvalues[cf.collections.index(sel.artist)]))

plt.show()

On floating bar chart, x-position behavior is inaccurate

The y-position seems accurate, but the x-position does not seem to work correctly. It seems to hit a fixed spot along the axis, regardless of where you click. For example, it's impossible to get a position at the beginning or end of the bar.

#! /usr/bin/env python
# -*- coding: utf-8 -*-

import matplotlib.pyplot as plt
import mplcursors
import random

def main():

    yvals = list("abcdefghijklmnopqrstuvwxyz")
    starts = []
    ends = []
    for y in yvals:
        start = random.randint(1, 1000)
        end = start + random.randint(500, 1000)
        starts.append(start)
        ends.append(end)

    fig, ax = plt.subplots()
    ax.barh(width=ends, left=starts, height=1.0, y=yvals)

    cursor = mplcursors.cursor(hover=True)
    @cursor.connect("add")
    def on_add(sel):
        x, y, width, height = sel.artist[sel.target.index].get_bbox().bounds
        sel.annotation.set(text=f"{yvals[round(y)]}: position {round(x+width/2)}",
                        position=(0, 20), anncoords="offset points")
        sel.annotation.xy = (x + width / 2, y + height)

    plt.show()

if __name__ == '__main__':
    main()

Linked artists lines and text

I tried to implement linked artists for the graph below:
image

It gave me a TypeError: cannot unpack non-iterable Annotation object matlibplot annotate error. Both the linear element and the annotation text on the right have the same "label" attached.

I was hoping to be able to click on a linear element and have the associated annotation text and the linear element highlighted and visa versa.

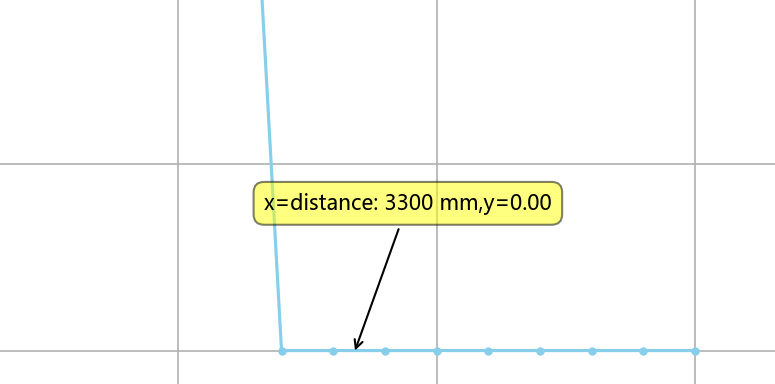
How can I make line2D only pickable at valid data point

Line2d is interpolated when using linestyle '-'. But I don't want these interpolated point to be pickable. Or is there any method that I can make the annotation pointing to the valid data point in cursor 'ADD' event?
image

Currently I'm working around this by plotting another line using linestyle with marker such as 'o', and creating a cursor on it.

line1 = axes[1].plot(x , y , label='_nolegend_')
line2 = axes[1].plot(x , y , 'o',label=label)
mplcursors.cursor(line2) 

Still I want to know is there a better way to do it.

Thanks.

label customized text on ax.scatter 3D graph, the index is wrong

When using
image
The tested index is wrong, the order is wrong.

for example, in the following graph:
image
the content in the table is correct, when id is 3, value should be 230, but in the graph, the annotated text for id 3 is the value of id 1. The order is messed up

TypeError: 'ContainerArtist' object is not subscriptable

How can I fix the problem in my script

import string
import matplotlib.pyplot as plt
import mplcursors

fig, ax = plt.subplots()
ax.bar(range(9), range(1, 10), align="center")
labels = string.ascii_uppercase[:9]
ax.set(xticks=range(9), xticklabels=labels, title="Hover over a bar")

cursor = mplcursors.cursor(hover=True)
@cursor.connect("add")
def on_add(sel):
    x, y, width, height = sel.artist[sel.target.index].get_bbox().bounds
    sel.annotation.set(
        text="{}: {}".format(x + width / 2, height),
        position=(0, 20))
    sel.annotation.xy = (x + width / 2, y + height)

plt.show()

Draggable cursor

Seems like pypi version fails the test suite if installed with python 3.6.

The git version doesn't. Do you think you will release a pypi version soon?

Bug with `multiple=True`

Hi, I get some really quirky behavior using the mplcursor.

I tried to capture it in a video uploaded on Google Drive.

Could you please have a look and tell me if you need more information?
Thanks.

matplotlib.use('Qt5Agg')
...
self.datacursor = mplcursors.cursor(self.ax, multiple=True)

pip freeze

certifi==2018.11.29
cycler==0.10.0
Cython==0.29.2
et-xmlfile==1.0.1
jdcal==1.4
kiwisolver==1.0.1
matplotlib==3.0.2
mkl-fft==1.0.6
mkl-random==1.0.1
mplcursors==0.2.1
mpldatacursor==0.6.2
numexpr==2.6.8
numpy==1.15.4
openpyxl==2.5.12
pandas==0.24.0.dev0+1366.g8b4b38fd7
pyparsing==2.3.0
PySide2==5.12.0
python-dateutil==2.7.5
pytz==2018.7
PyYAML==3.13
shiboken2==5.12.0
six==1.12.0
tables==3.4.4
xlrd==1.2.0

Cannot hide, disable and move cursor left or right in Qt5

I'm using Python 3.6, PyQt 5.6 and matplotlib 2.0.0. I cannot get the 'toggle-visibility' and ‘toggle_enabled’ keys to work. Neither Shift-Left and Shift-Right move the cursor “left” or “right” by one data point. Do I need to do something specific for this when using Qt5Agg backend?

How do I set 'enabled' value?

I'm playing around with your cursors, I'm trying to make it work like a 'two points difference', where the user selects 2 points from a line and gets an annotation showing the x values difference. I want to manually set the enabled value of one cursor's instance but I can't, I tried setting its value with cursor.enabled(value) but it seems enabled is a property and not a method.

Re-focus on cursor using mouse click

Hi,

Love mplcursors! When I add a second cursor to my canvas, I can move it around using keyboard bindings, which is great. However, I can not shift the focus back to my first cursor by clicking on it. Is there anyway to do that?

It works well for draggable annotations. I can drag any annotaion I want on the canvas, whether it is associated with the first or second cursor. I was hoping there was a way to define that if I click on an existing annotation/cursor, it shifts the focus to the cursor, and I could also shift/drag it along the plot using keyboard/mouse.

Thanks!
Orel.

Setup fails with proxy

Mplcursors setup.py makes a request without using proxy parameter, which hangs install.
Fails: python -m pip install mplcursors -v --proxy=proxyaddress.fr:3131
Successful workaround: python -m pip install setuptools_scm mplcursors -v --proxy=proxyaddress.fr:3131

`(PI) C:\Users\f30154\Documents\Python\PI>python -m pip install mplcursors -v --proxy=proxyaddress.fr:3131
Using pip 21.0 from C:\Users\f30154\Documents\Python\PI\PI\lib\site-packages\pip (python 3.8)
Non-user install because user site-packages disabled
Created temporary directory: C:\Users\f30154\AppData\Local\Temp\pip-ephem-wheel-cache-d8h3rv6d
Created temporary directory: C:\Users\f30154\AppData\Local\Temp\pip-req-tracker-6_p_32qx
Initialized build tracking at C:\Users\f30154\AppData\Local\Temp\pip-req-tracker-6_p_32qx
Created build tracker: C:\Users\f30154\AppData\Local\Temp\pip-req-tracker-6_p_32qx
Entered build tracker: C:\Users\f30154\AppData\Local\Temp\pip-req-tracker-6_p_32qx
Created temporary directory: C:\Users\f30154\AppData\Local\Temp\pip-install-6c84erdq
1 location(s) to search for versions of mplcursors:

Python 3.5 compatibility

Hello,

Two years ago I worked on a project on which I used a master version of mplcursors, it was after 0.1 and before 0.2, specifically "0.1+60.g96d4cf6". Now I'm trying to edit something in my code and I'm trying to download mplcursors again but I can't install version 0.2/0.3 because they demand python >= 3.6 (can't use that version due to other package restriction). Version 0.1 works on python 3.5 but it doesn't have a functionality I need: remove_selection. Can you see a workaround for this? Maybe retrieve version 0.1+60.g96d4cf6, or somehow make 0.2 compatible with python 3.5.

Regards.

Basic examples not working in Jupyter Lab

Hi, I tried to run two of the example codes ('basic' and 'hover'), but they don't seem to work. I just get a static image of the plot, without any error.
The package version is 0.3, installed with conda.
I'm using Jupyter Lab (version 1.2.4) on Chrome (macOS High Sierra)
I just downloaded the jupyter notebook examples and run them, without changing anything.
Any idea of what could be the problem?
Thanks

Anotations are kept after the graph is redrawed

Hi, I have a problem. Not sure it is your bug or not.

To update the graph, I simply remove all the lines and add other lines.
This still keeps some rouge annotations present.
The text update is

sel.annotation.set_text(annotation_str)

( I do it under mutex with the cursor remove).

Before updating the graph I do (removed some checks):

self.cursor.remove()
self.cursor.disconnect('add', cb=self.cb)
 for child in plt.gca().get_children():
            if isinstance(child, matplotlib.lines.Line2D):
                child.remove()
del self.cursor

Afterwards

dt.plot.line(reuse_plot=True, ax=ar)

self.cursor = mplcursors.cursor(hover=True)
self.cb= self.cursor.connect('add', partial(show_annotation,cls=self,ax=ar,generation=self.generation))

I also tried removing using self.curosr.remove_selection , keeping all selection object to no avail.

The thing is that I do those actions from possibly different threads. When it was the same thread it seemed to work.

I tried keeping self.cursor. At this time, no annotation was present.

Do you know what is the problem? Thanks for the help!

Don't override alignments set by the user in a callback

Hello @anntzer ,

Is there any special care when we use mplcursors in a PyQt embedded matplotlib graph? I observed two issues in this context:

  • Until now I could not manage how to change the 'deselect' action from right button to middle button of mouse. I set up a dict for bindings argument with '2' to 'deselect' key, but no response. Indeed, when I did that the right click lost the remove functionality, but the middle button was not able to remove.

  • Another issue is related to horizontal alignment of annotation. I'm using sel.annotation.set_ha('right') , but even outside of PyQt environment its not having instantaneous effect. It's strange because only after some clicks (and sometimes in specific points) the annotation "wake-up" and start to follow the set_ha instructions.

Do you have any idea of how to fix these issues?

Anyway, thanks for your attention.

Moving cursor left or right doesn't work with polar plots

Hi, so far this package has been awesome for an antenna design GUI I'm building, it makes heavy use of plots so I implement cursors everywhere. I recently tried to add a mplcursor to a matplotlib's polar plot and I want to use the 'left' and 'right' bindings in order to move along the trace. However, when I press the assigned keys to 'left' and 'right', the selection doesn't move to the next data point, instead, it blinks and stays in the same position. I've tried this function with normal cartesian plots and it works perfectly, but don't know what happens with polar plots.

Clicking on invisible lines still evinces an annotation

I'm porting a graphing tool (https://gitlab.com/eBardieCT/topplot/tree/ebardie/matplotlib) from using gnuplot to mpl. topplot implements toggling the visibility of lines by clicking on their legend lines.

It also makes use of mplcursors, so thanks BTW :), and I have found that even when a line is invisible, clicking where it would be displayed still leads to mplcursors displaying an annotation.

This trivial patch against mplcursors v0.3 resolves the problem for my use case, though you may wish to extend it to cover other potentially relevant artists.

--- _pick_info.py       2019-10-25 14:47:59.020688282 +0100
+++ _pick_info.py.new   2019-10-25 14:47:55.248639568 +0100
@@ -275,6 +275,9 @@
     # No need to call `line.contains` as we're going to redo the work anyways
     # (also see matplotlib/matplotlib#6645, though that's fixed in mpl2.1).

+    if artist.get_visible() == False:
+        return None
+
     # Always work in screen coordinates, as this is how we need to compute
     # distances.  Note that the artist transform may be different from the axes
     # transform (e.g., for axvline).

Thanks again,
Jonathan

Module index missing from doc

Hi!
In the previous version, I was able to use in my sphinx doc :mod:`mplcursors` link with sphinx.ext.intersphinx to point to the module's documentation in mine.

When checking python3 -m sphinx.ext.intersphinx https://mplcursors.readthedocs.io/en/stable/objects.inv
The link seems to not appear anymore

Push new version to PyPi?

Would it at all be possible to push a new version of mplcursors to pypi?

I'm developing a program that needs capabilities only available in the dev version. maybe 0.4.1?

I know this is an imposition.

Thanks

[Feature Request] Multiple Cursor Markers and Hover Functionality working Together

In the next release can you make the Multiple Cursor option and the hover option able to work together as whenever we are trying to mark some points using multiple it is better to have a pop-up label hovering with the cursor that makes it easy to select the points on the plots.

Right now when we try to do the same it throws ValueError: 'hover' and 'multiple' are incompatible

Add Highlight to LineCollection classe

I am using mplcursor and I would like to add highlight to LineCollection artists. However, this feature is not implemented. I tried to create a custom make_highlight for this type of artist classes, but I was unsuccessful since I barely understand what's really going on behind. Could you please add this feature? It will be really useful. Thank you in advance

Clicking on a legend in front of a line evinces an annotation

Even with the pick and click event callbacks always returning True, dict(), when a line is underneath a legend, clicking on the legend at a point over the line still passes the event on to mplcursors (after processing it as a pick event and then a click event in the main application).

Have I missed something in my setup or usage? Is this fixable within mplcursors? Or does this need addressing at the mpl level?

Regards,
Jonathan

Can you use mplcursor hover while zooming in?

I'm trying to use mplcursor hover when zooming in using Matplotlib but the artist is disappearing. It also never comes back even after zooming back out...

Is there any way around this? Because it would be very helpful if we can zoom in and still maintain the hover option or at the very least have it come back when zooming out.

HowTo: How can I add a cursor to a stacked column bar?

How can I obtain the total value of each label by hovering over a selected column?
The annotation text should consist of the corresponding label and associated value.

# https://stackoverflow.com/questions/44309507/stacked-bar-plot-using-matplotlib
import pandas as pd
import numpy as np
import matplotlib.pyplot as plt
import mplcursors
X_AXIS = ('60.0', '65.0', '70.0', '75.0', '80.0', '85.0', '90.0', '95.0', '100.0', '105.0', '110.0', '115.0', '120.0', '125.0', '130.0', '135.0', '140.0', '145.0', '150.0', '155.0', '160.0', '165.0', '170.0', '175.0', '180.0', '185.0', '190.0', '195.0', '200.0')

index = pd.Index(X_AXIS, name='test')

data = {'a': (0.0, 25.0, 48.94, 83.02, 66.67, 66.67, 70.97, 84.62, 93.33, 85.0, 92.86, 93.75, 95.0, 100.0, 100.0, 100.0, 100.0, 80.0, 100.0, 100.0, 100.0, 100.0, 100.0, 100.0, 100.0, 100.0, 100.0, 100.0, 100.0),
        'b': (0.0, 50.0, 36.17, 11.32, 26.67, 33.33, 29.03, 15.38, 6.67, 15.0, 7.14, 6.25, 5.0, 0.0, 0.0, 0.0, 0.0, 20.0, 0.0, 0.0, 0.0, 0.0, 0.0, 0.0, 0.0, 0.0, 0.0, 0.0, 0.0),
        'c': (0.0, 12.5, 10.64, 3.77, 4.45, 0.0, 0.0, 0.0, 0.0, 0.0, 0.0, 0.0, 0.0, 0.0, 0.0, 0.0, 0.0, 0.0, 0.0, 0.0, 0.0, 0.0, 0.0, 0.0, 0.0, 0.0, 0.0, 0.0, 0.0),
        'd': (100.0, 12.5, 4.26, 1.89, 2.22, 0.0, 0.0, 0.0, 0.0, 0.0, 0.0, 0.0, 0.0, 0.0, 0.0, 0.0, 0.0, 0.0, 0.0, 0.0, 0.0, 0.0, 0.0, 0.0, 0.0, 0.0, 0.0, 0.0, 0.0)}

df = pd.DataFrame(data, index=index)
ax = df.plot(kind='bar', stacked=True, figsize=(10, 6))
cursor = mplcursors.cursor(ax)
#@cursor.connect("add")
#def on_add(sel):
#    sel.extras.append(cursor.add_highlight(df[sel.artist]))

#mplcursors.cursor().connect(
#    "add",lambda sel: sel.annotation.set_text(df[df.keys()[3]][sel.target.index]))
#plt.show()

ax.set_ylabel('foo')
plt.legend(title='labels', bbox_to_anchor=(1.0, 1), loc='upper left')
# plt.savefig('stacked.png')  # if needed
plt.show()

zorder not respected

Hey,
i am not sure, if i should be doing it differently.
But i am encountering the issue "annotation does not respect zorder / it is always under one of the axes".

Here is an sscce:

import mplcursors
from matplotlib import pyplot as plt

figure, axis_1 = plt.subplots()
axis_2 = axis_1.twinx()
line_1 = axis_1.plot([1, 2])
line_2 = axis_2.plot([2, 1])
lines = [line for a in figure.axes for line in a.lines]
cursor = mplcursors.cursor(lines, hover=True)  # annotation_kwargs={'zorder': 9999} throws "multiple 'zorder' values"
@cursor.connect("add")
def _(sel):
    sel.annotation.get_bbox_patch().set(alpha=1, zorder=9999)
plt.show()

It would be great, if you could point me to some resolution or a workaround...

Having different labels for different plots on the same axes

Hi,

I am currently wanting to create a 3D scatter plot with matplotlib in python to try and show stock and flow data in 3D. The interactive labels of mplcursors are really good, however, I have hit a wall with something I would like to do so asking for help here.

I am wanting to plot 2 or more scatter plots on the same axes, e.g. some dots represents stocks and some other ideas. I want these to have different style attributes like marker style, colour and size and so on. However, I have become a bit stuck when trying to set different labels for the different scatter plots. It keeps adding the labels and making them overlap which I don't want. Here is my current code:

fig = plt.figure()
ax = fig.add_subplot(111, projection='3d')

x_stock =[0, 1, 2]
y_stock =[0, 0, 0]
z_stock =[1, 1, 1]

x_process =[0, 0, 0]
y_process =[1, 0, 0]
z_process =[2, 0, 0]

labels = ["Stock_1", "Stock_2", "Stock_3"]
labels_2 = ["Process_1", "Process_2", "Process_3"]

ax.scatter(x_stock, y_stock, z_stock, c='r', marker='o')

mplcursors.cursor(ax).connect("add", lambda sel: sel.annotation.set_text(labels[sel.target.index]))
ax.scatter(x_process, y_process, z_process, c="g", marker="o", s=200)


mplcursors.cursor(ax).connect("add", lambda sel: sel.annotation.set_text(labels_2[sel.target.index]))

a1 = Arrow3D([0, 1], [0, 0], [1, 1], mutation_scale=20, lw=3, arrowstyle="-|>", color="k", connectionstyle="arc3,rad=.5")
ax.add_artist(a1)

plt.axis("off")
plt.show()

I would like it if the first scatter plot only had the stock labels and the second only the process labels. Any help would be greatly appreciated.

John.

Unit tests fail with numpy 1.19 and matplotlib 3.3.0

There are comparison failures for formatted coordinates and a non iterable LineCollection

numpy 1.19.0
matplotlib 3.3.0
(system packages on openSUSE Tumbleweed)

[   38s] + pytest-3.8 --ignore=_build.python2 --ignore=_build.python3 --ignore=_build.pypy3 -v
[   38s] ============================= test session starts ==============================
[   38s] platform linux -- Python 3.8.3, pytest-5.4.3, py-1.9.0, pluggy-0.13.1 -- /usr/bin/python3
[   38s] cachedir: .pytest_cache
[   38s] rootdir: /home/abuild/rpmbuild/BUILD/mplcursors-0.3, inifile: setup.cfg
[   39s] collecting ... collected 70 items
[   39s] 
[   39s] tests/test_mplcursors.py::test_containerartist PASSED                    [  1%]
[   39s] tests/test_mplcursors.py::test_selection_identity_comparison PASSED      [  2%]
[   39s] tests/test_mplcursors.py::test_degenerate_inputs PASSED                  [  4%]
[   39s] tests/test_mplcursors.py::test_line[Axes.plot] PASSED                    [  5%]
[   40s] tests/test_mplcursors.py::test_line[Axes.fill] PASSED                    [  7%]
[   40s] tests/test_mplcursors.py::test_scatter[<lambda>] PASSED                  [  8%]
[   40s] tests/test_mplcursors.py::test_scatter[Axes.scatter] PASSED              [ 10%]
[   40s] tests/test_mplcursors.py::test_scatter_text FAILED                       [ 11%]
[   40s] tests/test_mplcursors.py::test_steps_index PASSED                        [ 12%]
[   40s] tests/test_mplcursors.py::test_steps_pre PASSED                          [ 14%]
[   41s] tests/test_mplcursors.py::test_steps_mid PASSED                          [ 15%]
[   41s] tests/test_mplcursors.py::test_steps_post PASSED                         [ 17%]
[   41s] tests/test_mplcursors.py::test_line_single_point[-] PASSED               [ 18%]
[   41s] tests/test_mplcursors.py::test_line_single_point[o] PASSED               [ 20%]
[   41s] tests/test_mplcursors.py::test_nan[plot_args0-click0-targets0] PASSED    [ 21%]
[   41s] tests/test_mplcursors.py::test_nan[plot_args1-click1-targets1] PASSED    [ 22%]
[   41s] tests/test_mplcursors.py::test_nan[plot_args2-click2-targets2] PASSED    [ 24%]
[   41s] tests/test_mplcursors.py::test_repeated_point PASSED                     [ 25%]
[   42s] tests/test_mplcursors.py::test_image[lower] FAILED                       [ 27%]
[   43s] tests/test_mplcursors.py::test_image[upper] FAILED                       [ 28%]
[   44s] tests/test_mplcursors.py::test_image_rgb PASSED                          [ 30%]
[   44s] tests/test_mplcursors.py::test_image_subclass PASSED                     [ 31%]
[   45s] tests/test_mplcursors.py::test_linecollection PASSED                     [ 32%]
[   45s] tests/test_mplcursors.py::test_patchcollection PASSED                    [ 34%]
[   45s] tests/test_mplcursors.py::test_quiver_and_barbs[Axes.quiver] FAILED      [ 35%]
[   45s] tests/test_mplcursors.py::test_quiver_and_barbs[Axes.barbs] PASSED       [ 37%]
[   45s] tests/test_mplcursors.py::test_bar[Axes.bar-order0] PASSED               [ 38%]
[   45s] tests/test_mplcursors.py::test_bar[Axes.barh-order1] PASSED              [ 40%]
[   46s] tests/test_mplcursors.py::test_errorbar FAILED                           [ 41%]
[   46s] tests/test_mplcursors.py::test_dataless_errorbar PASSED                  [ 42%]
[   46s] tests/test_mplcursors.py::test_stem FAILED                               [ 44%]
[   46s] tests/test_mplcursors.py::test_misc_artists[<lambda>-False] PASSED       [ 45%]
[   46s] tests/test_mplcursors.py::test_misc_artists[<lambda>-True] PASSED        [ 47%]
[   48s] tests/test_mplcursors.py::test_indexless_projections PASSED              [ 48%]
[   48s] tests/test_mplcursors.py::test_cropped_by_axes PASSED                    [ 50%]
[   54s] tests/test_mplcursors.py::test_move[Axes.plot] PASSED                    [ 51%]
[   60s] tests/test_mplcursors.py::test_move[Axes.scatter] PASSED                 [ 52%]
[   66s] tests/test_mplcursors.py::test_move[Axes.errorbar] PASSED                [ 54%]
[   66s] tests/test_mplcursors.py::test_hover PASSED                              [ 55%]
[   67s] tests/test_mplcursors.py::test_highlight[Axes.plot] PASSED               [ 57%]
[   67s] tests/test_mplcursors.py::test_highlight[Axes.scatter] PASSED            [ 58%]
[   67s] tests/test_mplcursors.py::test_misc_artists_highlight PASSED             [ 60%]
[   67s] tests/test_mplcursors.py::test_callback PASSED                           [ 61%]
[   68s] tests/test_mplcursors.py::test_remove_while_adding PASSED                [ 62%]
[   68s] tests/test_mplcursors.py::test_no_duplicate PASSED                       [ 64%]
[   69s] tests/test_mplcursors.py::test_remove_multiple_overlapping PASSED        [ 65%]
[   69s] tests/test_mplcursors.py::test_autoalign PASSED                          [ 67%]
[   69s] tests/test_mplcursors.py::test_drag PASSED                               [ 68%]
[   69s] tests/test_mplcursors.py::test_removed_artist PASSED                     [ 70%]
[   69s] tests/test_mplcursors.py::test_remove_cursor PASSED                      [ 71%]
[   71s] tests/test_mplcursors.py::test_keys PASSED                               [ 72%]
[   71s] tests/test_mplcursors.py::test_convenience PASSED                        [ 74%]
[   71s] tests/test_mplcursors.py::test_invalid_args PASSED                       [ 75%]
[   71s] tests/test_mplcursors.py::test_multiple_figures PASSED                   [ 77%]
[   71s] tests/test_mplcursors.py::test_gc PASSED                                 [ 78%]
[   72s] tests/test_mplcursors.py::test_example[examples/change_popup_color.py] PASSED [ 80%]
[   73s] tests/test_mplcursors.py::test_example[examples/highlight.py] PASSED     [ 81%]
[   73s] tests/test_mplcursors.py::test_example[examples/nondraggable.py] PASSED  [ 82%]
[   74s] tests/test_mplcursors.py::test_example[examples/scatter.py] PASSED       [ 84%]
[   74s] tests/test_mplcursors.py::test_example[examples/image.py] PASSED         [ 85%]
[   75s] tests/test_mplcursors.py::test_example[examples/bar.py] PASSED           [ 87%]
[   75s] tests/test_mplcursors.py::test_example[examples/labeled_points.py] PASSED [ 88%]
[   76s] tests/test_mplcursors.py::test_example[examples/basic.py] PASSED         [ 90%]
[   77s] tests/test_mplcursors.py::test_example[examples/date.py] PASSED          [ 91%]
[   77s] tests/test_mplcursors.py::test_example[examples/keyboard_shortcuts.py] PASSED [ 92%]
[   78s] tests/test_mplcursors.py::test_example[examples/hover.py] PASSED         [ 94%]
[   78s] tests/test_mplcursors.py::test_example[examples/artist_labels.py] PASSED [ 95%]
[   79s] tests/test_mplcursors.py::test_example[examples/contour.py] PASSED       [ 97%]
[   79s] tests/test_mplcursors.py::test_example[examples/step.py] PASSED          [ 98%]
[   80s] tests/test_mplcursors.py::test_example[examples/paired_highlight.py] PASSED [100%]
[   80s] 
[   80s] =================================== FAILURES ===================================
[   80s] ______________________________ test_scatter_text _______________________________
[   80s] 
[   80s] ax = <AxesSubplot:>
[   80s] 
[   80s]     def test_scatter_text(ax):
[   80s]         ax.scatter([0, 1], [0, 1], c=[2, 3])
[   80s]         cursor = mplcursors.cursor()
[   80s]         _process_event("__mouse_click__", ax, (0, 0), 1)
[   80s] >       assert cursor.selections[0].annotation.get_text() == "x=0\ny=0\n[2]"
[   80s] E       AssertionError: assert 'x=0.000\ny=0.000\n[2.000]' == 'x=0\ny=0\n[2]'
[   80s] E         - x=0
[   80s] E         - y=0
[   80s] E         - [2]
[   80s] E         + x=0.000
[   80s] E         + y=0.000
[   80s] E         + [2.000]
[   80s] 
[   80s] tests/test_mplcursors.py:166: AssertionError
[   80s] ______________________________ test_image[lower] _______________________________
[   80s] 
[   80s] ax = <AxesSubplot:>, origin = 'lower'
[   80s] 
[   80s]     @pytest.mark.parametrize("origin", ["lower", "upper"])
[   80s]     def test_image(ax, origin):
[   80s]         array = np.arange(6).reshape((3, 2))
[   80s]         ax.imshow(array, origin=origin)
[   80s]     
[   80s]         cursor = mplcursors.cursor()
[   80s]         # Annotation text includes image value.
[   80s]         _process_event("__mouse_click__", ax, (.25, .25), 1)
[   80s]         sel, = cursor.selections
[   80s]         assert (_parse_annotation(sel, r"x=(.*)\ny=(.*)\n\[0\]")
[   80s]                 == approx((.25, .25)))
[   80s]         # Moving around.
[   80s]         _process_event("key_press_event", ax, (.123, .456), "shift+right")
[   80s]         sel, = cursor.selections
[   80s] >       assert sel.annotation.get_text() == "x=1\ny=0\n[1]"
[   80s] E       AssertionError: assert 'x=1.000\ny=0.000\n[1]' == 'x=1\ny=0\n[1]'
[   80s] E         - x=1
[   80s] E         - y=0
[   80s] E         + x=1.000
[   80s] E         + y=0.000
[   80s] E           [1]
[   80s] 
[   80s] tests/test_mplcursors.py:268: AssertionError
[   80s] ______________________________ test_image[upper] _______________________________
[   80s] 
[   80s] ax = <AxesSubplot:>, origin = 'upper'
[   80s] 
[   80s]     @pytest.mark.parametrize("origin", ["lower", "upper"])
[   80s]     def test_image(ax, origin):
[   80s]         array = np.arange(6).reshape((3, 2))
[   80s]         ax.imshow(array, origin=origin)
[   80s]     
[   80s]         cursor = mplcursors.cursor()
[   80s]         # Annotation text includes image value.
[   80s]         _process_event("__mouse_click__", ax, (.25, .25), 1)
[   80s]         sel, = cursor.selections
[   80s]         assert (_parse_annotation(sel, r"x=(.*)\ny=(.*)\n\[0\]")
[   80s]                 == approx((.25, .25)))
[   80s]         # Moving around.
[   80s]         _process_event("key_press_event", ax, (.123, .456), "shift+right")
[   80s]         sel, = cursor.selections
[   80s] >       assert sel.annotation.get_text() == "x=1\ny=0\n[1]"
[   80s] E       AssertionError: assert 'x=1.000\ny=0.000\n[1]' == 'x=1\ny=0\n[1]'
[   80s] E         - x=1
[   80s] E         - y=0
[   80s] E         + x=1.000
[   80s] E         + y=0.000
[   80s] E           [1]
[   80s] 
[   80s] tests/test_mplcursors.py:268: AssertionError
[   80s] ______________________ test_quiver_and_barbs[Axes.quiver] ______________________
[   80s] 
[   80s] ax = <AxesSubplot:>, plotter = <function Axes.quiver at 0x7fc85b317550>
[   80s] 
[   80s]     @pytest.mark.parametrize("plotter", [Axes.quiver, Axes.barbs])
[   80s]     def test_quiver_and_barbs(ax, plotter):
[   80s]         plotter(ax, range(3), range(3))
[   80s]         cursor = mplcursors.cursor()
[   80s]         _process_event("__mouse_click__", ax, (.5, 0), 1)
[   80s]         assert len(cursor.selections) == 0
[   80s]         _process_event("__mouse_click__", ax, (1, 0), 1)
[   80s] >       assert cursor.selections[0].annotation.get_text() == "x=1\ny=0\n(1, 1)"
[   80s] E       AssertionError: assert 'x=1.000\ny=0.0000\n(1, 1)' == 'x=1\ny=0\n(1, 1)'
[   80s] E         - x=1
[   80s] E         - y=0
[   80s] E         + x=1.000
[   80s] E         + y=0.0000
[   80s] E           (1, 1)
[   80s] 
[   80s] tests/test_mplcursors.py:342: AssertionError
[   80s] ________________________________ test_errorbar _________________________________
[   80s] 
[   80s] ax = <AxesSubplot:>
[   80s] 
[   80s]     def test_errorbar(ax):
[   80s]         ax.errorbar(range(2), range(2), [(1, 1), (1, 2)])
[   80s]         cursor = mplcursors.cursor()
[   80s]         assert len(cursor.artists) == 1
[   80s]         _process_event("__mouse_click__", ax, (0, 2), 1)
[   80s]         assert len(cursor.selections) == 0
[   80s]         _process_event("__mouse_click__", ax, (.5, .5), 1)
[   80s]         assert cursor.selections[0].target == approx((.5, .5))
[   80s]         assert (_parse_annotation(cursor.selections[0], "x=(.*)\ny=(.*)")
[   80s]                 == approx((.5, .5)))
[   80s]         _process_event("__mouse_click__", ax, (0, 1), 1)
[   80s]         assert cursor.selections[0].target == approx((0, 0))
[   80s] >       assert cursor.selections[0].annotation.get_text() == "x=0\ny=$0\\pm1$"
[   80s] E       AssertionError: assert 'x=0.000\ny=$....00}^{+1.00}$' == 'x=0\ny=$0\\pm1$'
[   80s] E         - x=0
[   80s] E         - y=$0\pm1$
[   80s] E         + x=0.000
[   80s] E         + y=$0.00_{+−1.00}^{+1.00}$
[   80s] 
[   80s] tests/test_mplcursors.py:370: AssertionError
[   80s] __________________________________ test_stem ___________________________________
[   80s] 
[   80s] ax = <AxesSubplot:>
[   80s] 
[   80s]     def test_stem(ax):
[   80s]         with pytest.warns(None):  # stem use_line_collection API change.
[   80s]             ax.stem([1, 2, 3])
[   80s]         cursor = mplcursors.cursor()
[   80s]         assert len(cursor.artists) == 1
[   80s] >       _process_event("__mouse_click__", ax, (.5, .5), 1)
[   80s] 
[   80s] tests/test_mplcursors.py:390: 
[   80s] _ _ _ _ _ _ _ _ _ _ _ _ _ _ _ _ _ _ _ _ _ _ _ _ _ _ _ _ _ _ _ _ _ _ _ _ _ _ _ _ 
[   80s] tests/test_mplcursors.py:63: in _process_event
[   80s]     _process_event("button_press_event", ax, coords, *args)
[   80s] tests/test_mplcursors.py:74: in _process_event
[   80s]     ax.figure.canvas.callbacks.process(name, event)
[   80s] /usr/lib64/python3.8/site-packages/matplotlib/cbook/__init__.py:224: in process
[   80s]     func(*args, **kwargs)
[   80s] ../../BUILDROOT/python-mplcursors-0.3-11.1.x86_64/usr/lib/python3.8/site-packages/mplcursors/_mplcursors.py:485: in _nonhover_handler
[   80s]     self._on_select_button_press(event)
[   80s] ../../BUILDROOT/python-mplcursors-0.3-11.1.x86_64/usr/lib/python3.8/site-packages/mplcursors/_mplcursors.py:520: in _on_select_button_press
[   80s]     pi = _pick_info.compute_pick(artist, per_axes_event[artist.axes])
[   80s] /usr/lib64/python3.8/functools.py:875: in wrapper
[   80s]     return dispatch(args[0].__class__)(*args, **kw)
[   80s] ../../BUILDROOT/python-mplcursors-0.3-11.1.x86_64/usr/lib/python3.8/site-packages/mplcursors/_pick_info.py:419: in _
[   80s]     return compute_pick(artist.container, event)
[   80s] /usr/lib64/python3.8/functools.py:875: in wrapper
[   80s]     return dispatch(args[0].__class__)(*args, **kw)
[   80s] _ _ _ _ _ _ _ _ _ _ _ _ _ _ _ _ _ _ _ _ _ _ _ _ _ _ _ _ _ _ _ _ _ _ _ _ _ _ _ _ 
[   80s] 
[   80s] container = <StemContainer object of 3 artists>
[   80s] event = <matplotlib.backend_bases.MouseEvent object at 0x7fc85b0b03d0>
[   80s] 
[   80s]     @compute_pick.register(StemContainer)
[   80s]     def _(container, event):
[   80s]         sel = compute_pick(container.markerline, event)
[   80s]         if sel:
[   80s]             return sel
[   80s]         idx_sel = min(filter(lambda idx_sel: idx_sel[1] is not None,
[   80s]                              ((idx, compute_pick(line, event))
[   80s] >                             for idx, line in enumerate(container.stemlines))),
[   80s]                       key=lambda idx_sel: idx_sel[1].dist, default=None)
[   80s] E       TypeError: 'LineCollection' object is not iterable
[   80s] 
[   80s] ../../BUILDROOT/python-mplcursors-0.3-11.1.x86_64/usr/lib/python3.8/site-packages/mplcursors/_pick_info.py:469: TypeError
[   80s] =========================== short test summary info ============================
[   80s] FAILED tests/test_mplcursors.py::test_scatter_text - AssertionError: assert '...
[   80s] FAILED tests/test_mplcursors.py::test_image[lower] - AssertionError: assert '...
[   80s] FAILED tests/test_mplcursors.py::test_image[upper] - AssertionError: assert '...
[   80s] FAILED tests/test_mplcursors.py::test_quiver_and_barbs[Axes.quiver] - Asserti...
[   80s] FAILED tests/test_mplcursors.py::test_errorbar - AssertionError: assert 'x=0....
[   80s] FAILED tests/test_mplcursors.py::test_stem - TypeError: 'LineCollection' obje...
[   80s] ======================== 6 failed, 64 passed in 41.68s =====

how can i make my confusion matrix interactive and retrace back to the problematic data?

@anntzer
I have a set of PDF documents, and I want to extract certain entities. I have a list of correctly labeled entities, and my set of predicted labels. I can produce the confusion matrix. But when I see there is a mis-classification, i.e. anything off-diagonal, I want an easy way to see what's wrong. For example, I want to click on the cell in the confusion matrix, and it would automatically display the associated true label and my incorrect prediction.

mplcursors in plots with several scatter objects: only the last labels list is considered

First of all, thank you for this great library.

I wonder if I could get some sugestions on how to use mplcursors in plots with several ax.scatter objects. This is an example:

import numpy as np
import matplotlib.pyplot as plt
import mplcursors

x_1 = np.array([1, 2, 3])
y_1 = x_1
labels1 = ['a', 'b', 'c']

x_2 = np.array([1, 2, 3, 4])
y_2 = x_2 * 2
labels2 = ['d', 'e', 'f', 'g']

x_values = [x_1, x_2]
y_values = [y_1, y_2]
labels = [labels1, labels2]

fig, ax = plt.subplots(figsize=(10, 10))

for i, x in enumerate(x_values):
    data_scatter = ax.scatter(x, y_values[i], label=f'{i}')
    mplcursors.cursor(data_scatter).connect("add", lambda sel: sel.annotation.set_text(labels[i][sel.target.index]))

ax.legend()
plt.show()

If you click on the data points you will notice that the second label list (labels2) is show on both data sets.

Thanks for any advice

can't import mplcursors

ModuleNotFoundError: No module named 'mplcursors'.

Did something break, and if so, should I be able to find it somewhere? Thanks!

mplcursors don't work with cartopy

There are several issues with mplcursors ant cartopy (https://scitools.org.uk/cartopy/docs/v0.17/index.html). Here is a script that illustrates those issues:

import os
import sys
import numpy as np
from cartopy import config
import cartopy.feature as cfeature
import cartopy.crs as ccrs
import matplotlib.pyplot as plt
from mplcursors import cursor

def ex1():
    ax = plt.axes(projection=ccrs.Mollweide())
    #ax.set_extent(np.array([-180, 180, -90, 90]) * 1e5)
    ax.stock_img()
    p = ax.coastlines()
    g_lon, g_lat = 19, 50
    a_lon, a_lat = -150, 61
    line = ax.plot([g_lon, a_lon], [g_lat, a_lat], 'ro-', transform=ccrs.Geodetic())
    c = cursor(line)

def ex2():
    fig = plt.figure(figsize=(8, 12))

    # get the path of the file. It can be found in the repo data directory.
    fname = os.path.join(config["repo_data_dir"],
                         'raster', 'sample', 'Miriam.A2012270.2050.2km.jpg'
                        )
    img_extent = (-120.67660000000001, -106.32104523100001,
                  13.2301484511245, 30.766899999999502)
    img = plt.imread(fname)

    ax = plt.axes(projection=ccrs.PlateCarree())
    plt.title('Hurricane Miriam from the Aqua/MODIS satellite\n'
              '2012 09/26/2012 20:50 UTC')

    # set a margin around the data
    ax.set_xmargin(0.05)
    ax.set_ymargin(0.10)

    # add the image. Because this image was a tif, the "origin" of the image
    # is in the upper left corner
    ax.imshow(img, origin='upper', extent=img_extent,
              transform=ccrs.PlateCarree())
    ax.coastlines(resolution='50m', color='black', linewidth=1)

    # mark a known place to help us geo-locate ourselves
    ax.plot(-117.1625, 32.715, 'bo', markersize=7, transform=ccrs.Geodetic())
    ax.text(-117, 33, 'San Diego', transform=ccrs.Geodetic())
    c = cursor(ax)

def ex3():
    def fmt(u, v):
        w = u + 1j * v
        ws = np.abs(w)
        wd = np.angle(w, deg=True)
        return '{:.1f} {:.0f}'.format(ws, 270-wd)

    fig = plt.figure(figsize=(8, 6))
    ak_west = -170
    ak_east = -130
    ak_south = 52
    ak_north = 72
    central_longitude = -150
    true_scale_latitude = 60
    wlon = np.array([[-170, -140], [-170, -140]]) 
    wlat = np.array([[68, 68], [63, 63]]) 
    wu = np.array([[0, 10], [10, 0]])
    wv = np.array([[10, 0], [0, 10]])
    w = zip(wu.flatten(), wv.flatten())
    labels = [fmt(u, v) for (u, v) in w]
    proj = ccrs.NorthPolarStereo(central_longitude=central_longitude,
                                 true_scale_latitude=true_scale_latitude)
    ax = fig.add_subplot(1, 1, 1, projection=proj)
    ax.set_extent([ak_west, ak_east, ak_south, ak_north])
    ax.gridlines(xlocs=range(-190, -109, 10), ylocs=range(50, 76, 5))
    ax.add_feature(cfeature.LAND, alpha=0.2)
    ax.add_feature(cfeature.OCEAN, alpha=0.3);
    ax.add_feature(cfeature.BORDERS);
    barbs = ax.barbs(wlon, wlat, wu, wv, transform=ccrs.PlateCarree(),
                     length=10, linewidth=2)

    def cact(sel):
        return sel.annotation.set_text(labels[sel.target.index])

    c = cursor(barbs)
    c.connect('add', cact)

ex = [ex1, ex2, ex3]

ex[int(sys.argv[1])-1]()
plt.show()

Example 1 runs fine:
> python examples.py
The line annotation is displayed correctly.

An attempt to get location on the image in example 2 produces an error:

> python examples.py 2
Traceback (most recent call last):
  File "/home/george.trojan/miniconda3/lib/python3.7/site-packages/matplotlib/cbook/__init__.py", line 215, in process
    func(*args, **kwargs)
  File "/home/george.trojan/miniconda3/lib/python3.7/site-packages/mplcursors/_mplcursors.py", line 441, in _nonhover_handler
    self._on_select_button_press(event)
  File "/home/george.trojan/miniconda3/lib/python3.7/site-packages/mplcursors/_mplcursors.py", line 476, in _on_select_button_press
    pi = _pick_info.compute_pick(artist, per_axes_event[artist.axes])
  File "/home/george.trojan/miniconda3/lib/python3.7/functools.py", line 824, in wrapper
    return dispatch(args[0].__class__)(*args, **kw)
  File "/home/george.trojan/miniconda3/lib/python3.7/site-packages/mplcursors/_pick_info.py", line 370, in _
    idxs = ((xy - low) / (high - low) * ns).astype(int)[::-1]
ValueError: operands could not be broadcast together with shapes (2,) (3,)

The same error would show in example 1 as well if the cursor was tracking all artists associated with the axes, i.e. when cursor(line) is replaced by cursor(ax).

In example 3 the wind barbs cannot be labeled.

I made an attempt to fix the code, the only changes are in file _pick_info.py. Here is a diff on the "fix":

> diff _pick_info.py _pick_info.py.orig
325a326
>         ax = artist.axes
328,330c329,330
<         # GT fix
<         offsets = artist.get_offset_transform().transform(offsets)
<         ds = np.hypot(*(offsets - [event.x, event.y]).T)
---
>         ds = np.hypot(*(ax.transData.transform(offsets)
>                         - [event.x, event.y]).T)
332,333c332
<         offsets = artist.axes.transData.inverted().transform(offsets[argmin])
<         target = with_attrs(offsets, index=inds[argmin])
---
>         target = with_attrs(offsets[argmin], index=inds[argmin])
364,365c363
<     # GT fix: 3rd coordinate might be colours and transparency
<     ns = np.asarray(artist.get_array().shape[:2])[::-1]  # (y, x) -> (x, y)
---
>     ns = np.asarray(artist.get_array().shape)[::-1]  # (y, x) -> (x, y)
381,383c379,380
<     # GT fix
<     offsets = artist.get_offset_transform().transform(offsets)
<     ds = np.hypot(*(offsets - [event.x, event.y]).T)
---
>     ds = np.hypot(
>         *(artist.axes.transData.transform(offsets) - [event.x, event.y]).T)
386,387c383
<         offsets = artist.axes.transData.inverted().transform(offsets[argmin])
<         target = with_attrs(offsets, index=argmin)
---
>         target = with_attrs(offsets[argmin], index=argmin)

The error in example2 is trivial: the artist (image) can be 2 or 3 dimensional array, only first 2 matter. To fix example 3 one has to use artist transform, not transData. Similar fix is needed to label scatter plot.

I doubt I have caught everything.

Cartopy and mplcursors are from conda-forge:

> conda list mplcursors
# packages in environment at /home/george.trojan/miniconda3:                   
#                                                                              
# Name                    Version                   Build  Channel             
mplcursors                0.2.1                      py_0    conda-forge       
(base) pointyhaired@gtrojan> conda list cartopy
# packages in environment at /home/george.trojan/miniconda3:                   
#
# Name                    Version                   Build  Channel
cartopy                   0.17.0          py37h0aa2c8f_1004    conda-forge

Hover-over highlighting is only momentary

I’m having trouble keeping the boxes highlighted while hovering over them. Unless I remove my finger from the mousepad or (with a mouse attached) stop moving the mouse the moment the mouse pointer touches the bar the highlight only lasts momentarily.

Minimal working code example below (using border highlight only) that exhibits this behaviour for me.

import matplotlib.pyplot as plt
import mplcursors

fig, ax = plt.subplots()
ax.bar(range(9), range(1, 10), align="center")

cursor = mplcursors.cursor(hover=True)

@cursor.connect("add")
def on_add(sel):
    x, y, width, height = sel.artist[sel.target.index].get_bbox().bounds
    sel.annotation.set(text=f"{x+width/2}: {height}", position=(0, 5))
    sel.annotation.xy = (x + width / 2, y + height)
    sel.artist[sel.target.index].set_edgecolor('r')

@cursor.connect("remove")
def on_remove(sel):
    sel.artist[sel.target.index].set_edgecolor('w')

plt.show()

Comment from @anntzer

Almost certainly this is because the highlighting code shares basically all event handling with the annotation code, but they should likely be slightly split so that the highlight doesn’t get removed until the cursor goes away.

[Feature Request] Vertical Marker style cursors

Can you try to add vertical markers that can be varied along the X axis to display the corresponding Y values on the plots. This is somewhat like those markers we get in oscilloscopes or spectrum analyzers where we can vary the x coordinate in order to find the respective y coordinates from the plots.

Problem when implementing mplcursors and matplotlib blitting

Hey, recently I've been learning to use matplotlib's blitting feature to make my GUI's plotting faster. But I notice the mplcursors don't work well when I do it, there are a few issues to mention:

  • Some bounding boxes dissapear
  • When I press left or right to move along the trace it's slow.
  • On matplotlib's animations, after I pause the animation to detail the plot, if I select an artist, the artist dissapears.

I have a callback function for whenever my PyQt4 canvas is drawn and I can see that mplcursors draws the canvas each time I make a selection, I thought mplcursors what based on blitting.

Is it possible to make mplcursors work with plots based on blitting?

Problem with displaying artist's label instead of x,y

Hi

I'm trying the example https://mplcursors.readthedocs.io/en/latest/examples/artist_labels.html on python3, matplotlib 2.2.2

On clicking a line I get the following error:

Traceback (most recent call last):
File "/Library/Frameworks/Python.framework/Versions/3.6/lib/python3.6/site-packages/matplotlib/cbook/init.py", line 388, in process
proxy(*args, **kwargs)
File "/Library/Frameworks/Python.framework/Versions/3.6/lib/python3.6/site-packages/matplotlib/cbook/init.py", line 228, in call
return mtd(*args, **kwargs)
File "/Library/Frameworks/Python.framework/Versions/3.6/lib/python3.6/site-packages/mplcursors/_mplcursors.py", line 434, in _nonhover_handler
self._on_select_button_press(event)
File "/Library/Frameworks/Python.framework/Versions/3.6/lib/python3.6/site-packages/mplcursors/_mplcursors.py", line 474, in _on_select_button_press
self.add_selection(min(pis, key=lambda pi: pi.dist))
File "/Library/Frameworks/Python.framework/Versions/3.6/lib/python3.6/site-packages/mplcursors/_mplcursors.py", line 355, in add_selection
figure.canvas.blit()
TypeError: blit() missing 1 required positional argument: 'bbox'

zorder

When the zorder of a line is defined, the annotation which has a higher zorder doesn't display on top of the line. An extra click on the annotation is needed to move it on top of the line. It happens for both hover False and True modes. See the code below:

import string
import matplotlib.pyplot as plt
import mplcursors
fig, ax = plt.subplots()
ax.bar(range(9), range(1, 10), align="center",zorder=10)
labels = string.ascii_uppercase[:9]
ax.set(xticks=range(9), xticklabels=labels, title="Hover over a bar")

cursor = mplcursors.cursor(hover=False)
@cursor.connect("add")
def on_add(sel):
    x, y, width, height = sel.artist[sel.target.index].get_bbox().bounds
    sel.annotation.set(text=f"{x+width/2}: {height}",
    position=(0, -20), anncoords="offset points")
    sel.annotation.xy = (x + width / 2, y + height)
    sel.annotation.get_bbox_patch().set(fc="white",zorder=20, alpha=1)
    sel.annotation.arrow_patch.set(arrowstyle="simple", fc="white", alpha=1)

plt.show()

HowTo: Programatically add cursors

How could I programmatically add cursors? My full use-case is that I'd like to be able to save/restore cursors between sessions, and it seems like the first step would be to capture the "add" events and save them off... but how would I restore them? It's not clear from the API docs whether you support adding cursors by xy points.

Don't use `blit` with matplotlib>=3.0.0

When one sets multiple cursors one over the other and then clicks right mouse button to remove the latest cursor, all of them get removed. To avoid the behavior, I have added break to the loop in _on_key_press function. To my surprise, now all the cursor balloons disappear but only one gets removed. When I set the cursor invisible and back visible, I see the remaining balloons. It seems that using blit is not the best idea due to the matplotlib annotation bug. Please change

ann.draggable(use_blit=True)

to

ann.draggable(use_blit=False)

or, better, add an option to remove just one balloon and an option to turn blit off.

Annotation does not delete originally positioned one when moved.

When doing the 4-line example from the website:

import matplotlib.pyplot as plt
import numpy as np
import mplcursors

data = np.outer(range(10), range(1, 5))

fig, ax = plt.subplots()
lines = ax.plot(data)
ax.set_title("Click somewhere on a line.\nRight-click to deselect.\n"
             "Annotations can be dragged.")
fig.tight_layout()

mplcursors.cursor(lines)

plt.show()

When I go to re-position a label, it doesn't delete the original one. See attached video.

Versions:
OS: MacOS 10.15.7 (Catalina)
python package installer and venv manager: conda v4.12.0
Python: v3.9.12
matplotlib: v3.5.1
mplcursors: v0.5.1

mplcursor_reposition_bug.mp4

Using mplcursors to toggle visibility of line?

Hi- I have just found mplcursors and it is very useful for a task I am trying to do. I also wonder, is it possible to toggle the visibility of a selected line by (for example) right clicking on a line in a plot? Something like:

def right_click(event):
if event.button == 1:
mplcursors.cursor(ax, visbility=False)
fig.canvas.callbacks.connect('button_press_event', right_click)

Thanks!

String indexing error

Hello @anntzer and thank you for your library.

I have this issue which I cannot nail down. In this code, I want mplcursors to display a different text than the one in the legend:

import numpy as np
import matplotlib.pyplot as plt
import mplcursors

x_1 = np.array([1, 2, 3])
y_1 = x_1

x_2 = np.array([1, 2, 3, 4])
y_2 = x_2 * 2

x_values = [x_1, x_2]
y_values = [y_1, y_2]
labels_mplcursors = ['m = 1', 'm = 2']
labels_legend = ['Dataset 1', 'Dataset 2']

fig, ax = plt.subplots(figsize=(10, 10))

container = {}
for i, x in enumerate(x_values):
    line = ax.plot(x, y_values[i], label=labels_legend[i])
    container[labels_mplcursors[i]] = line

for label, line in container.items():
    mplcursors.cursor(line).connect("add", lambda sel, labels_group=label: sel.annotation.set_text(labels_group[sel.index]))

ax.legend()
plt.show()

Clicking on the lines brings this issue:

TypeError: string indices must be integers
My guess is that it is using the data or the matplotlib line objects ax plot to loop through something... I wonder if you could please point me in the right direction.

Thank you

Recommend Projects

  • React photo React

    A declarative, efficient, and flexible JavaScript library for building user interfaces.

  • Vue.js photo Vue.js

    🖖 Vue.js is a progressive, incrementally-adoptable JavaScript framework for building UI on the web.

  • Typescript photo Typescript

    TypeScript is a superset of JavaScript that compiles to clean JavaScript output.

  • TensorFlow photo TensorFlow

    An Open Source Machine Learning Framework for Everyone

  • Django photo Django

    The Web framework for perfectionists with deadlines.

  • D3 photo D3

    Bring data to life with SVG, Canvas and HTML. 📊📈🎉

Recommend Topics

  • javascript

    JavaScript (JS) is a lightweight interpreted programming language with first-class functions.

  • web

    Some thing interesting about web. New door for the world.

  • server

    A server is a program made to process requests and deliver data to clients.

  • Machine learning

    Machine learning is a way of modeling and interpreting data that allows a piece of software to respond intelligently.

  • Game

    Some thing interesting about game, make everyone happy.

Recommend Org

  • Facebook photo Facebook

    We are working to build community through open source technology. NB: members must have two-factor auth.

  • Microsoft photo Microsoft

    Open source projects and samples from Microsoft.

  • Google photo Google

    Google ❤️ Open Source for everyone.

  • D3 photo D3

    Data-Driven Documents codes.