- Clone this repository.
- Create a virtualenv:
virtualenv venv- Activate the virtualenv:
source venv/bin/activate- Install the requirements:
pip install -r requirements.txt-
Set environment variables to:
- environment (local | prod):
ENV
- generate preprocessed views (True | False):
GENERATE_VIEWS
- environment (local | prod):
-
Start the Flask application on your original terminal window:
venv/bin/python run.py- Go to
http://localhost:8558/eduvis/and enjoy this application!
This project was part of my Ph.D. research performed between 2016 and 2020, which we shed light on how to support instructors in analyzing student logs from Virtual Learning Environments. Our main goal in this project is enable Virtual Learning Environments to assist instructors in gaining insights about both students’ behavior and performance.
Firstly, we conducted interviews with instructors who work in Brazil and a systematic mapping of the state-of-art about Education Data Mining and Learning Analytics. This study aimed to identify which kinds of information about students the instructors regard as meaningful (e.g., performance, behavior, engagement); how these kinds of information are gathered; and how they drive requirements for improving their analyses.
Then, we analyzed logs from online courses offered in Brazil and compared our findings with results presented in the literature. We explored and analyzed these logs using statistical methods and machine learning techniques.
Furthermore, we have not found in the literature works about instructors’ visualization preferences of student logs. Therefore, we conducted a study to identify how much the instructors take into account topics related to both students’ behavior and performance, as well as their visualization preferences.
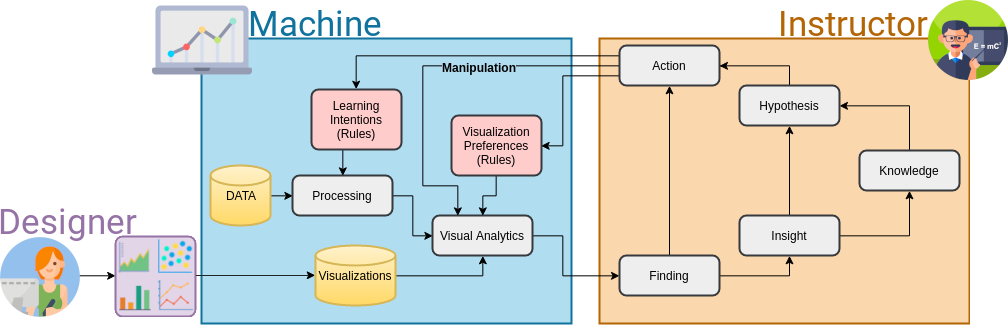
We also noted a lack of work showing models to support the development of learning analytics tools. In order to bridge this gap, we presented a model connecting both Visual Analytics theories and models as well as instructors’ requirements, their visualization preferences, literature guidelines and methods for analyzing student logs.
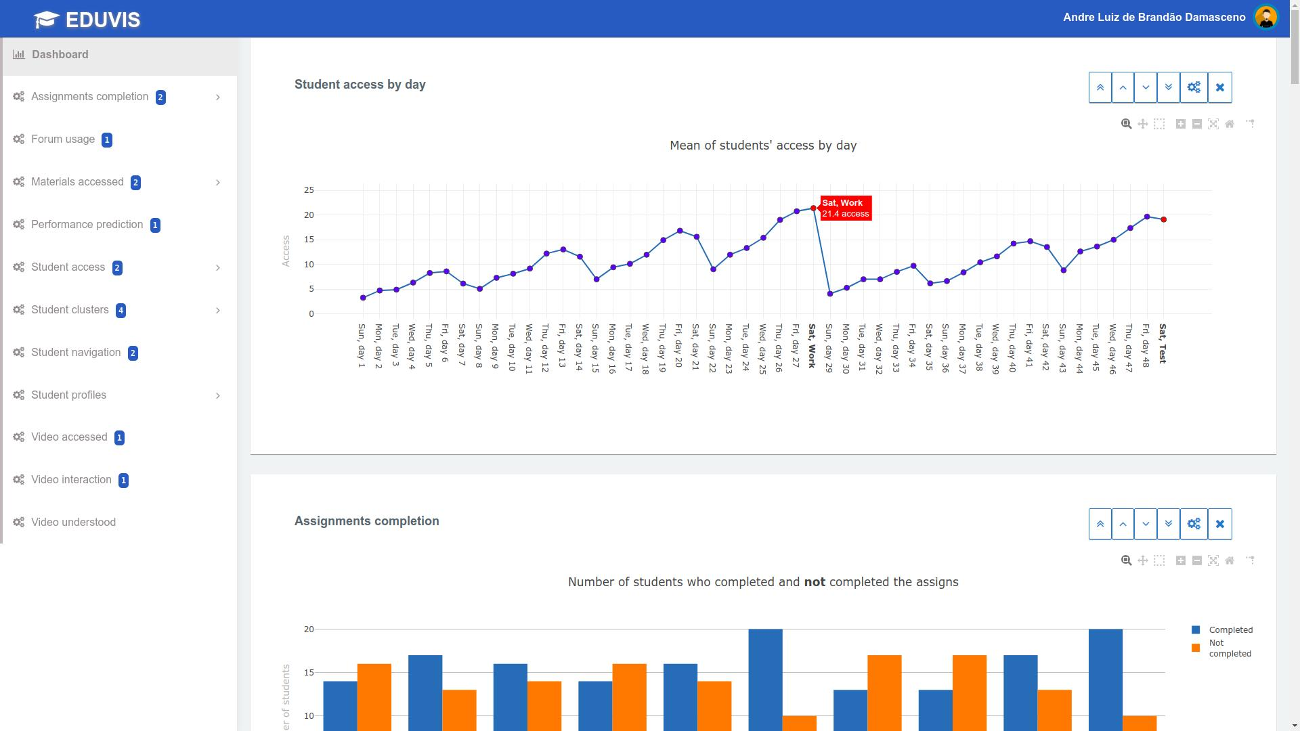
We developed EDUVIS as an open source online tool to assemble dashboards based on our proposed model. This tool was built using Python and Javascript. In particular, all the visualizations (total of 141) were designed using Plotly, which provides interactivity, such as zoom in, zoom out, pan, select, toggle spike lines, and mouse hover.
We captured evidence of their acceptance of our proposal and obtained instructors’ feedback about the tool such as their both analysis and visualization preferences. The combination of the answers to the research questions yields a framework to enable Virtual Learning Environments to assist instructors in gaining insights about both students’ behavior and performance. We hope that our proposed model might be a guide to the development of new dashboards and ground future research.