ElastiFlow™ provides network flow data collection and visualization using the Elastic Stack. It supports Netflow v5/v9, sFlow and IPFIX flow types (1.x versions support only Netflow v5/v9).
Release 3.x is designed for use with the Elastic Stack 6.2 and higher. If you are using an older version of the Elastic Stack, please use version 2.1 or 1.2.

I was inspired to create ElastiFlow™ following the overwhelmingly positive feedback received to an article I posted on Linkedin... WTFlow?! Are you really still paying for commercial solutions to collect and analyze network flow data?
ElastiFlow™ is built using the Elastic Stack, including Elasticsearch, Logstash and Kibana. To install and configure ElastiFlow™, you must first have a working Elastic Stack environment. The latest release of ElastiFlow™ requires version 6.2 or later.
Refer to the following compatibility chart to choose a release of ElastiFlow™ that is compatible with the version of the Elastic Stack you are using.
| Elastic Stack | ElastiFlow™ 1.x | ElastiFlow™ 2.x | ElastiFlow™ 3.x |
|---|---|---|---|
| 6.3 | ✓ | ||
| 6.2 | ✓ | ✓ | ✓ |
| 6.1 | ✓ | ✓ | |
| 6.0 | ✓ | ✓ | |
| 5.6 | ✓ | ✓ | |
| 5.5 | ✓ | ||
| 5.4 | ✓ |
NOTE: The instructions that follow are for ElastiFlow™ 3.x.
Please be aware that in production environments the volume of data generated by many network flow sources can be considerable. It is not uncommon for a core router or firewall to produce 1000s of flow records per second. For this reason it is recommended that ElastiFlow™ be given its own dedicated Logstash instance. Multiple instances may be necessary as the volume of flow data increases.
Due to the way NIC receive queues and the Linux kernel interact, raw UDP packet reception will be bound to a single CPU core and kernel receive buffer. While additional UDP input workers allow Logstash to share the load of processing packets from the receive buffer, it does not scale linearly. As worker threads are increased, so is contention for buffer access. The sweetspot seems to be to use 4-core Logstash instances, adding additional instances as needed for high-volume environments.
It is my experience that most people underestimate the volume of flow data their network will produce. Save yourself the headache and don't start too small. Use the following table as a guide:
| flows/sec | (v)CPUs | Memory | Disk (30-days) | ES JVM Heap | LS JVM Heap |
|---|---|---|---|---|---|
| 250 | 4 | 24 GB | 305 GB | 8 GB | 4 GB |
| 1000 | 8 | 32 GB | 1.22 TB | 12 GB | 4 GB |
| 2500 | 12 | 64 GB | 3.05 TB | 24 GB | 6 GB |
For anything beyond 2500 flows/sec a multi-node cluster should be considered, and that Logstash be run on its own instance/server.
The above recommendations are a starting point. Once you are up and running you can make adjustments based on the actual load of your environment.
I plan to do some additional benchmarking soon, and will update the above table based on those results.
Currently there is no specific configuration required for Elasticsearch. As long as Kibana and Logstash can talk to your Elasticsearch cluster you should be ready to go. The index template required by Elasticsearch will be uploaded by Logstash.
At high ingest rates (>10K flows/s), or for data redundancy and high availability, a multi-node cluster is recommended.
IMPORTANT!!! If you are upgrading from version 2.x of ElastiFlow™ you MUST delete the old
elastiflowindex template from Elasticsearch PRIOR to starting Logstash with the v3.0.0 pipeline. This can be done by executingDELETE _template/elastiflowfrom Dev Tools --> Console in Kibana. UseGET _templateto confirm that it was deleted.
The ElastiFlow™ Logstash pipeline is the heart of the solution. It is here that the raw flow data is collected, decoded, parsed, formatted and enriched. It is this processing that makes possible the analytics options provided by the Kibana dashboards.
Follow these steps to ensure that Logstash and ElastiFlow™ are optimally configured to meet your needs.
To increase performance, ElastiFlow™ takes advantage of the caching and queueing features available in many of the Logstash plugins. These features increase the consumption of the JVM heap. The JVM heap space used by Logstash is configured in jvm.options. It is recommended that Logstash be given at least 2GB of JVM heap. If all options, incl. DNS lookups (requires version 3.0.10 or later of the DNS filter), are enabled increase this to 4GB. This is configured in jvm.options as follows:
-Xms4g
-Xmx4g
To use ElastiFlow™ you will need to install the community supported sFlow codec for Logstash. It is also recommended that you always use the latest version of the Netflow codec, the UDP input, and the DNS filter. This can achieved by running the following commands:
LS_HOME/bin/logstash-plugin install logstash-codec-sflow
LS_HOME/bin/logstash-plugin update logstash-codec-netflow
LS_HOME/bin/logstash-plugin update logstash-input-udp
LS_HOME/bin/logstash-plugin update logstash-filter-dns
There are four sets of configuration files provided within the logstash/elastiflow folder:
logstash
  `- elastiflow
       |- conf.d  (contains the logstash pipeline)
       |- dictionaries (yaml files used to enrich raw flow data)
       |- geoipdbs  (contains GeoIP databases)
       `- templates  (contains index templates)
Copy the elastiflow directory to the location of your Logstash configuration files (e.g. on RedHat/CentOS or Ubuntu this would be /etc/logstash/elastiflow ). If you place the ElastiFlow™ pipeline within a different path, you will need to modify the following environment variables to specify the correct location:
| Environment Variable | Description | Default Value |
|---|---|---|
| ELASTIFLOW_DICT_PATH | The path where the dictionary files are located | /etc/logstash/elastiflow/dictionaries |
| ELASTIFLOW_TEMPLATE_PATH | The path to where index templates are located | /etc/logstash/elastiflow/templates |
| ELASTIFLOW_GEOIP_DB_PATH | The path where the GeoIP DBs are located | /etc/logstash/elastiflow/geoipdbs |
Rather than directly editing the pipeline configuration files for your environment, environment variables are used to provide a single location for most configuration options. These environment variables will be referred to in the remaining instructions. A reference of all environment variables can be found here.
Depending on your environment there may be many ways to define environment variables. The files profile.d/elastiflow.sh and logstash.service.d/elastiflow.conf are provided to help you with this setup.
Recent versions of both RedHat/CentOS and Ubuntu use systemd to start background processes. When deploying ElastiFlow™ on a host where Logstash will be managed by systemd, copy logstash.service.d/elastiflow.conf to /etc/systemd/system/logstash.service.d/elastiflow.conf. Any configuration changes can then be made by editing this file.
Remember that for your changes to take effect, you must issue the command
sudo systemctl daemon-reload.
Logstash 6.0 introduced the ability to run multiple pipelines from a single Logstash instance. The pipelines.yml file is where these pipelines are configured. While a single pipeline can be specified directly in logstash.yml, it is a good practice to use pipelines.yml for consistency across environments.
Edit pipelines.yml (usually located at /etc/logstash/pipelines.yml) and add the ElasiFlow™ pipeline (adjust the path as necessary).
- pipeline.id: elastiflow
  path.config: "/etc/logstash/elastiflow/conf.d/*.conf"
By default flow data will be recieved on all IPv4 addresses of the Logstash host using the standard ports for each flow type. You can change both the IPs and ports used by modifying the following environment variables:
| Environment Variable | Description | Default Value |
|---|---|---|
| ELASTIFLOW_NETFLOW_IPV4_HOST | The IP address from which to listen for Netflow messages | 0.0.0.0 |
| ELASTIFLOW_NETFLOW_IPV4_PORT | The UDP port on which to listen for Netflow messages | 2055 |
| ELASTIFLOW_SFLOW_IPV4_HOST | The IP address from which to listen for sFlow messages | 0.0.0.0 |
| ELASTIFLOW_SFLOW_IPV4_PORT | The UDP port on which to listen for sFlow messages | 6343 |
| ELASTIFLOW_IPFIX_TCP_IPV4_HOST | The IP address from which to listen for IPFIX messages via TCP | 0.0.0.0 |
| ELASTIFLOW_IPFIX_TCP_IPV4_PORT | The port on which to listen for IPFIX messages via TCP | 4739 |
| ELASTIFLOW_IPFIX_UDP_IPV4_HOST | The IP address from which to listen for IPFIX messages via UDP | 0.0.0.0 |
| ELASTIFLOW_IPFIX_UDP_IPV4_PORT | The port on which to listen for IPFIX messages via UDP | 4739 |
Collection of flows over IPv6 is disabled by default to avoid issues on systems without IPv6 enabled. To enable IPv6 rename the following files in the elastiflow/conf.d directory, removing .disabled from the end of the name: 10_input_ipfix_ipv6.logstash.conf.disabled, 10_input_netflow_ipv6.logstash.conf.disabled, 10_input_sflow_ipv6.logstash.conf.disabled. Similiar to IPv4, IPv6 input can be configured using environment variables:
| Environment Variable | Description | Default Value |
|---|---|---|
| ELASTIFLOW_NETFLOW_IPV6_HOST | The IP address from which to listen for Netflow messages | [::] |
| ELASTIFLOW_NETFLOW_IPV6_PORT | The UDP port on which to listen for Netflow messages | 52055 |
| ELASTIFLOW_SFLOW_IPV6_HOST | The IP address from which to listen for sFlow messages | [::] |
| ELASTIFLOW_SFLOW_IPV6_PORT | The UDP port on which to listen for sFlow messages | 56343 |
| ELASTIFLOW_IPFIX_TCP_IPV6_HOST | The IP address from which to listen for IPFIX messages via TCP | [::] |
| ELASTIFLOW_IPFIX_TCP_IPV6_PORT | The port on which to listen for IPFIX messages via TCP | 54739 |
| ELASTIFLOW_IPFIX_UDP_IPV6_HOST | The IP address from which to listen for IPFIX messages via UDP | [::] |
| ELASTIFLOW_IPFIX_UDP_IPV6_PORT | The port on which to listen for IPFIX messages via UDP | 54739 |
To improve UDP input performance for the typically high volume of flow collection, the default values for UDP input workers and queue_size is increased. The default values are 2 and 2000 respecitvely. ElastiFlow™ increases these to 4 and 4096. Further tuning is possible using the following environment variables.
| Environment Variable | Description | Default Value |
|---|---|---|
| ELASTIFLOW_NETFLOW_UDP_WORKERS | The number of Netflow input threads | 4 |
| ELASTIFLOW_NETFLOW_UDP_QUEUE_SIZE | The number of unprocessed Netflow UDP packets the input can buffer | 4096 |
| ELASTIFLOW_SFLOW_UDP_WORKERS | The number of sFlow input threads | 4 |
| ELASTIFLOW_SFLOW_UDP_QUEUE_SIZE | The number of unprocessed sFlow UDP packets the input can buffer | 4096 |
| ELASTIFLOW_IPFIX_UDP_WORKERS | The number of IPFIX input threads | 4 |
| ELASTIFLOW_IPFIX_UDP_QUEUE_SIZE | The number of unprocessed IPFIX UDP packets the input can buffer | 4096 |
WARNING! Increasing
queue_sizewill increase heap_usage. Make sure have configured JVM heap appropriately as specified in the Requirements
Obviously the data needs to land in Elasticsearch, so you need to tell Logstash where to send it. This is done by setting these environment variables:
| Environment Variable | Description | Default Value |
|---|---|---|
| ELASTIFLOW_ES_HOST | The Elasticsearch host to which the output will send data | 127.0.0.1:9200 |
| ELASTIFLOW_ES_SSL_ENABLE | Enable or disable SSL connection to Elasticsearch | false |
| ELASTIFLOW_ES_SSL_VERIFY | Enable or disable verification of the SSL certificate. If enabled, the output must be edited to set the path to the certificate. | false |
| ELASTIFLOW_ES_USER | The password for the connection to Elasticsearch | elastic |
| ELASTIFLOW_ES_PASSWD | The username for the connection to Elasticsearch | changeme |
If you are only using the open-source version of Elasticsearch, it will ignore the username and password. In that case just leave the defaults.
In the past it was recommended to avoid DNS queries as the latency costs of such lookups had a devastating effect on throughput. While the Logstash DNS filter provides a caching mechanism, its use was not recommended. When the cache was enabled all lookups were performed synchronously. If a name server failed to respond, all other queries were stuck waiting until the query timed out. The end result was even worse performance.
Fortunately these problems have been resolved. Release 3.0.8 of the DNS filter introduced an enhancement which caches timeouts as failures, in addition to normal NXDOMAIN responses. This was an important step as many domain owner intentionally setup their nameservers to ignore the reverse lookups needed to enrich flow data. In addition to this change, I submitted am enhancement which allows for concurrent queries when caching is enabled. The Logstash team approved this change, and it is included in 3.0.10 of the plugin.
With these changes I can finally give the green light for using DNS lookups to enrich the incoming flow data. You will see a little slow down in throughput until the cache warms up, but that usually lasts only a few minutes. Once the cache is warmed up, the overhead is minimal, and event rates averaging 10K/s and as high as 40K/s were observed in testing.
The key to good performance is setting up the cache appropriately. Most likely it will be DNS timeouts that are the source of most latency. So ensuring that a higher volume of such misses can be cached for longer periods of time is most important.
The DNS lookup features of ElastiFlow™ can be configured using the following environment variables:
| Environment Variable | Description | Default Value |
|---|---|---|
| ELASTIFLOW_RESOLVE_IP2HOST | Enable/Disable DNS requests | false |
| ELASTIFLOW_NAMESERVER | The DNS server to which the dns filter should send requests | 127.0.0.1 |
| ELASTIFLOW_DNS_HIT_CACHE_SIZE | The cache size for successful DNS queries | 25000 |
| ELASTIFLOW_DNS_HIT_CACHE_TTL | The time in seconds successful DNS queries are cached | 900 |
| ELASTIFLOW_DNS_FAILED_CACHE_SIZE | The cache size for failed DNS queries | 75000 |
| ELASTIFLOW_DNS_FAILED_CACHE_TTL | The time in seconds failed DNS queries are cached | 3600 |
Both Netflow and IPFIX allow devices with application identification features to specify the application associated with the traffic in the flow. For Netflow this is the application_id field. The IPFIX field is applicationId.
The application names which correspond to values of these IDs is vendor-specific. In order for ElastiFlow™ to accurately translate the ID values, it must be told the type of device that is exporting the flows. To do so you must edit elastiflow/dictionaries/app_id_srctype and specify the source type of your supported device. For example...
"192.0.2.1": "cisco_nbar2"
"192.0.2.2": "fortinet"
Currently supported is Cisco's NBAR2 and Fortinet's FortiOS. If you have a device that you would like added, I will need a mapping of Application IDs to names. This can often be extracted from the device's configuration. I would love to be able to build up a large knowledge base of such mappings.
You can also define a default source type value by setting the following environment variable:
| Environment Variable | Description | Default Value |
|---|---|---|
| ELASTIFLOW_DEFAULT_APPID_SRCTYPE | Sets the default source type for translating the App IDs to names. Valid values are cisco_nbar2 and fortinet |
__UNKNOWN |
The nDPI detected application name produced by nProbe is also supported as of ElastiFlow™ v3.0.3. No specific configuration of ElastiFlow™ is necessary. However, nProbe must be configured with a template that sends this data. An nProbe configuration file that works well with ElastiFlow™ is available HERE.
Once configured ElastiFlow™ will resolve the ID to an application name, which will be available in the dashboards.

You should now be able to start Logstash and begin collecting network flow data. Assuming you are running a recent version of RedHat/CentOS or Ubuntu, and using systemd, complete these steps:
- Run
systemctl daemon-reloadto ensure any changes to the environment variables are recognized. - Run
systemctl start logstash
NOTICE! Make sure that you have already setup the Logstash init files by running
LS_HOME/bin/system-install. If the init files have not been setup you will receive an error. To follow along as Logstash starts you can tail its log by running:
tail -f /var/log/logstash/logstash-plain.log
Logstash takes a little time to start... BE PATIENT!
If using Netflow v9 or IPFIX you will likely see warning messages related to the flow templates not yet being received. They will disappear after templates are received from the network devices, which should happen every few minutes. Some devices can take a bit longer to send templates. Fortinet in particular send templates rather infrequently.
Logstash setup is now complete. If you are receiving flow data, you should have an elastiflow- daily index in Elasticsearch.
An API (yet undocumented) is available to import and export Index Patterns. The JSON file which contains the Index Pattern configuration is kibana/elastiflow.index_pattern.json. To setup the elastiflow-* Index Pattern run the following command:
curl -X POST -u USERNAME:PASSWORD http://KIBANASERVER:5601/api/saved_objects/index-pattern/elastiflow-* -H "Content-Type: application/json" -H "kbn-xsrf: true" -d @/PATH/TO/elastiflow.index_pattern.json
Finally the vizualizations and dashboards can be loaded into Kibana by importing the elastiflow.dashboards.<VER>.json file from within the Kibana UI. This is done from the Management - > Saved Objects page. There are separate dashboard import files for version 6.2.x and 6.3.x of Kibana. Select the file that corresponds to your version of Kibana.
You may find that modifying a few of the Kibana advanced settings will produce a more user-friendly experience while using ElastiFlow™. These settings are made in Kibana, under Management -> Advanced Settings.
| Advanced Setting | Value | Why make the change? |
|---|---|---|
| doc_table:highlight | false | There is a pretty big query performance penalty that comes with using the highlighting feature. As it isn't very useful for this use-case, it is better to just trun it off. |
| filters:pinnedByDefault | true | Pinning a filter will it allow it to persist when you are changing dashbaords. This is very useful when drill-down into something of interest and you want to change dashboards for a different perspective of the same data. This is the first setting I change whenever I am working with Kibana. |
| state:storeInSessionStorage | true | Kibana URLs can get pretty large. Especially when working with Vega visualizations. This will likely result in error messages for users of Internet Explorer. Using in-session storage will fix this issue for these users. |
| timepicker:quickRanges | see below | The default options in the Time Picker are less than optimal, for most logging and monitoring use-cases. Fortunately Kibana now allows you to customize the time picker. Our recommended settings can be found see below. |
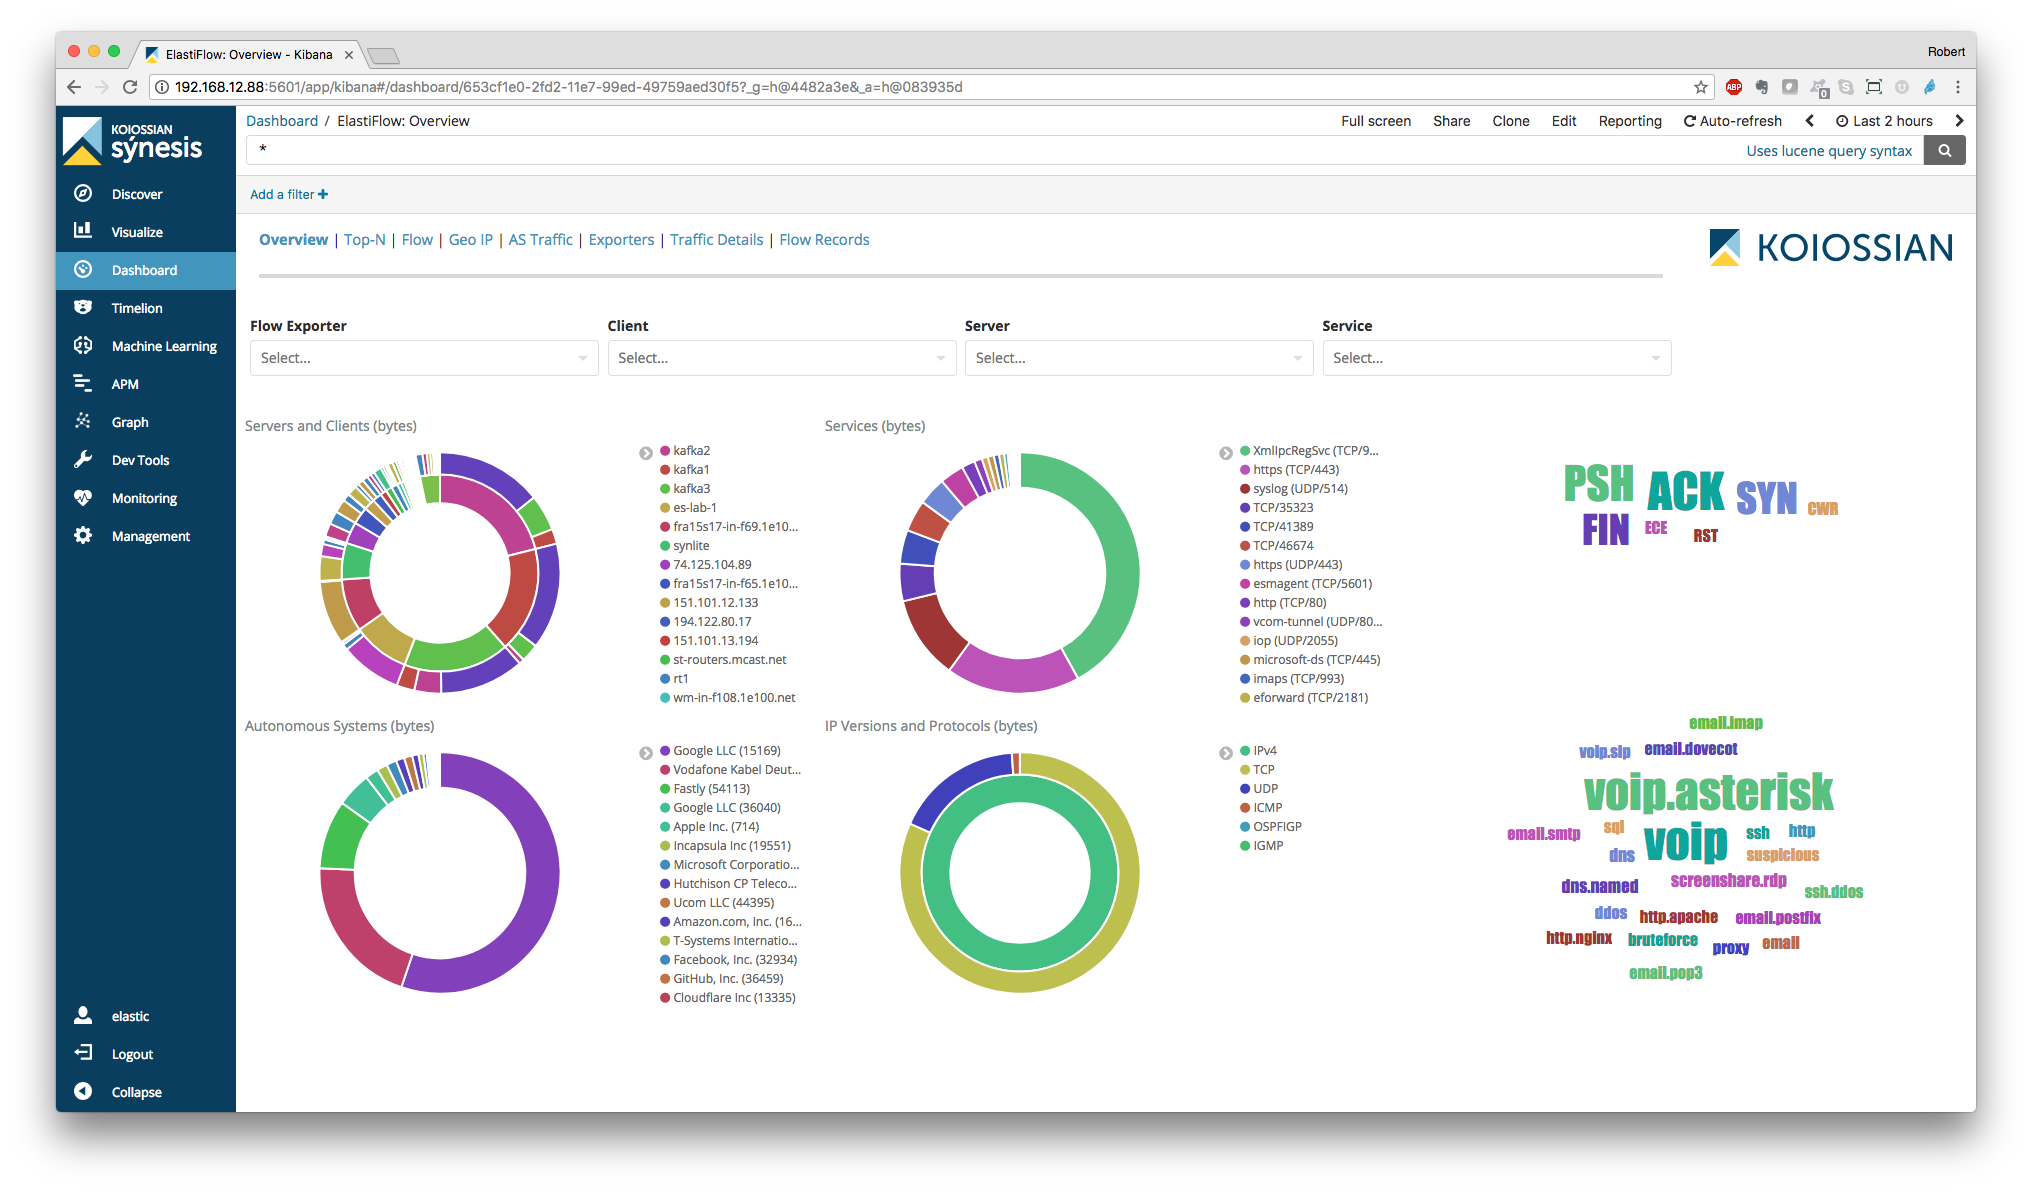
The following dashboards are provided.
NOTE: The dashboards are optimized for a monitor resolution of 1920x1080.
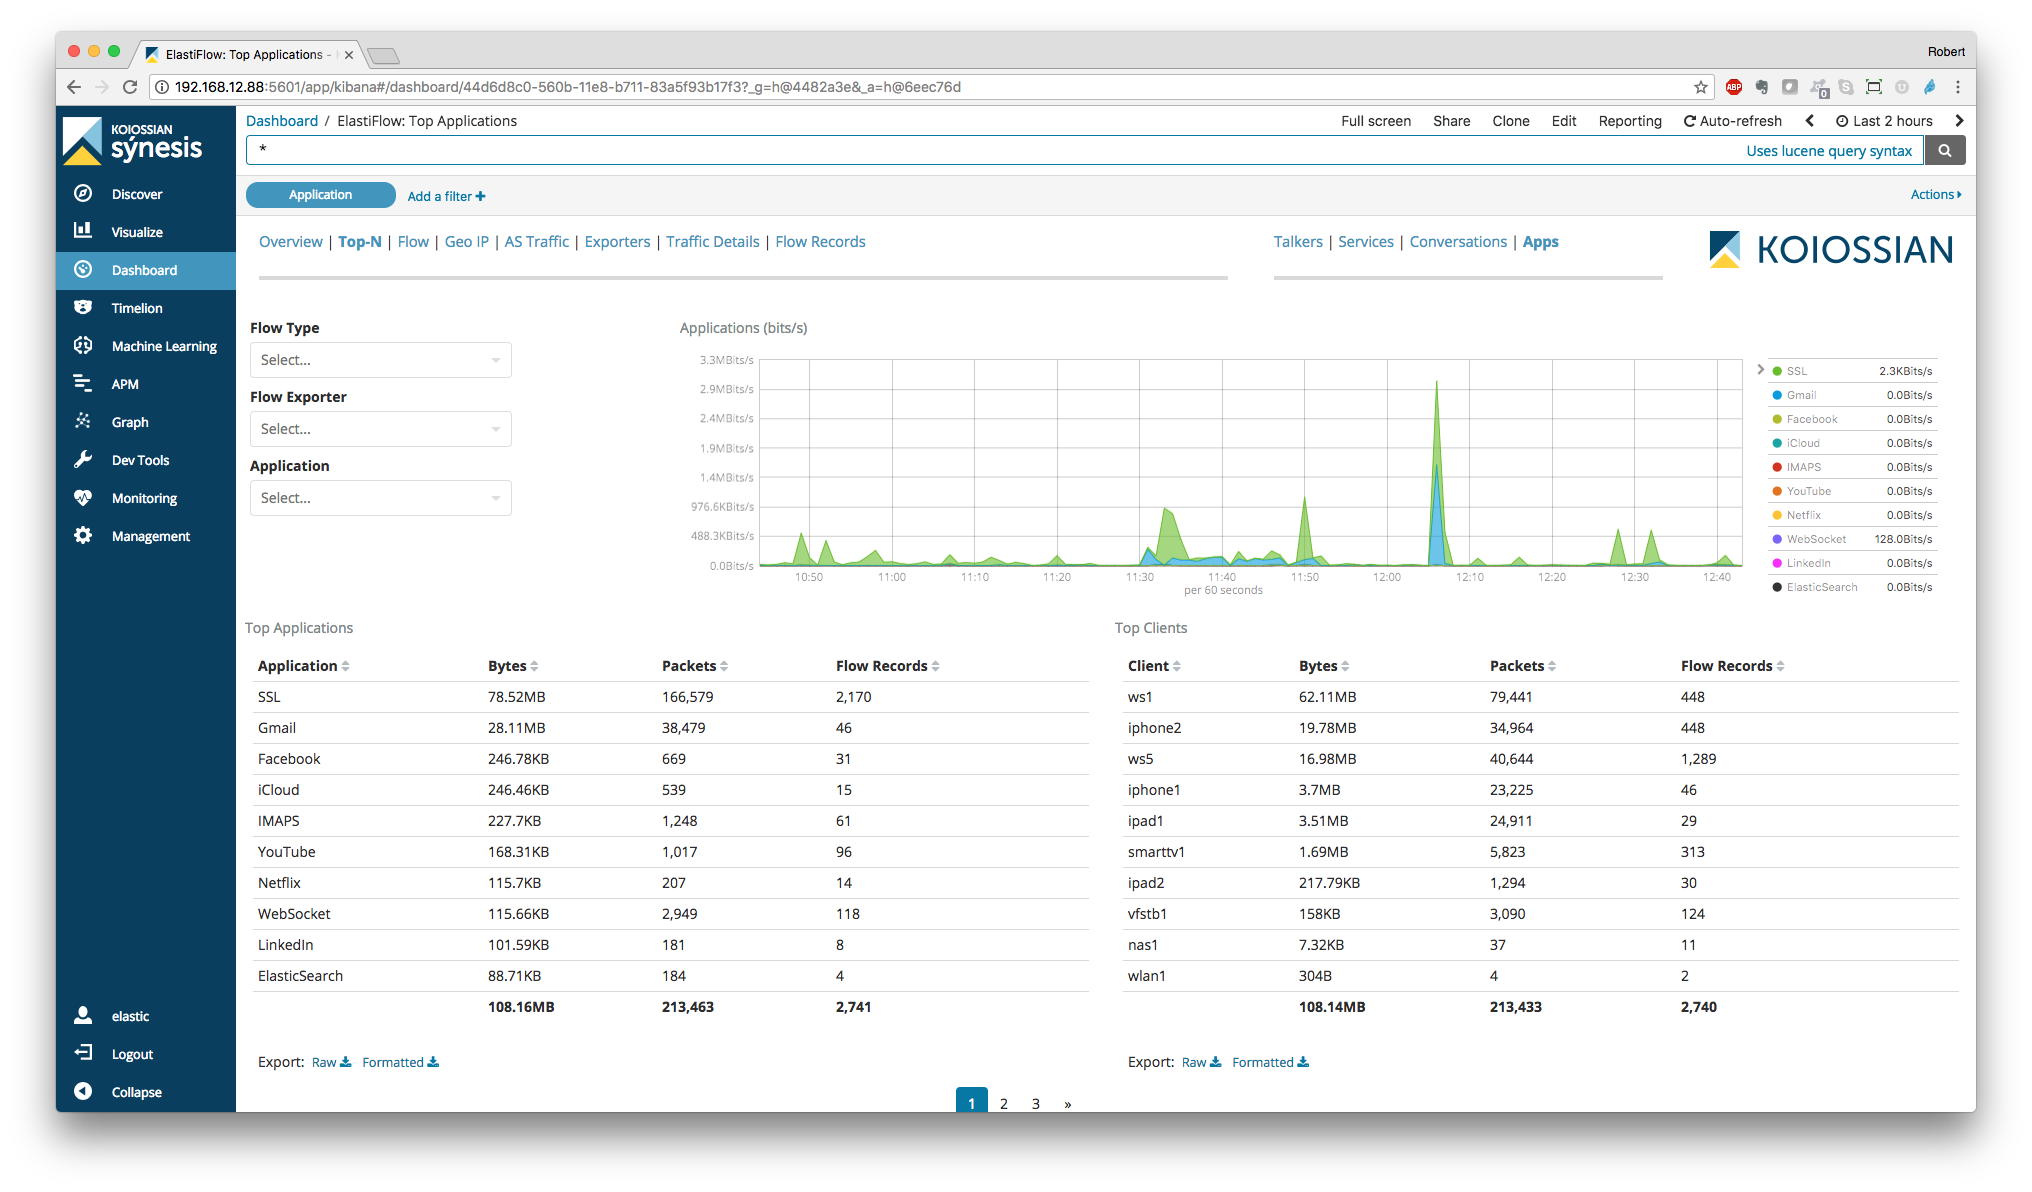
There are separate Top-N dashboards for Top Talkers, Services, Conversations and Applciations.
There are separate Sankey dashboards for Client/Server, Source/Destination and Autonomous System perspectives. The sankey visualizations are built using the new Vega visualization plugin.
NOTICE! While these visualizations work flawlessly on previous 6.2 versions, there are some anomalies on 6.2.4. For now consider these dashboards as experimental.

There are separate Geo Loacation dashboards for Client/Server and Source/Destination perspectives.

Provides a view of traffic to and from Autonomous Systems (public IP ranges)


The supported environment variables are:
| Environment Variable | Description | Default Value |
|---|---|---|
| ELASTIFLOW_DICT_PATH | The path where the dictionary files are located | /etc/logstash/elastiflow/dictionaries |
| ELASTIFLOW_TEMPLATE_PATH | The path to where index templates are located | /etc/logstash/elastiflow/templates |
| ELASTIFLOW_GEOIP_DB_PATH | The path where the GeoIP DBs are located | /etc/logstash/elastiflow/geoipdbs |
| ELASTIFLOW_GEOIP_CACHE_SIZE | The size of the GeoIP query cache | 8192 |
| ELASTIFLOW_GEOIP_LOOKUP | Enable/Disable GeoIP lookups | true |
| ELASTIFLOW_ASN_LOOKUP | Enable/Disable ASN lookups | true |
| ELASTIFLOW_KEEP_ORIG_DATA | If set to false the original netflow, ipfix and sflow objects will be deleted prior to indexing. This can save disk space without affecting the provided dashboards. However the original flow fields will no longer be available if they are desired for additional analytics. |
true |
| ELASTIFLOW_DEFAULT_APPID_SRCTYPE | Sets the default source type for translating the App IDs to names. Valid values are cisco_nbar2 and fortinet |
__UNKNOWN |
| ELASTIFLOW_RESOLVE_IP2HOST | Enable/Disable DNS requests | false |
| ELASTIFLOW_NAMESERVER | The DNS server to which the dns filter should send requests | 127.0.0.1 |
| ELASTIFLOW_DNS_HIT_CACHE_SIZE | The cache size for successful DNS queries | 25000 |
| ELASTIFLOW_DNS_HIT_CACHE_TTL | The time in seconds successful DNS queries are cached | 900 |
| ELASTIFLOW_DNS_FAILED_CACHE_SIZE | The cache size for failed DNS queries | 75000 |
| ELASTIFLOW_DNS_FAILED_CACHE_TTL | The time in seconds failed DNS queries are cached | 3600 |
| ELASTIFLOW_ES_HOST | The Elasticsearch host to which the output will send data | 127.0.0.1:9200 |
| ELASTIFLOW_ES_SSL_ENABLE | Enable or disable SSL connection to Elasticsearch | false |
| ELASTIFLOW_ES_SSL_VERIFY | Enable or disable verification of the SSL certificate. If enabled, the output must be edited to set the path to the certificate. | false |
| ELASTIFLOW_ES_USER | The password for the connection to Elasticsearch | elastic |
| ELASTIFLOW_ES_PASSWD | The username for the connection to Elasticsearch | changeme |
| ELASTIFLOW_NETFLOW_IPV4_HOST | The IP address on which to listen for Netflow messages | 0.0.0.0 |
| ELASTIFLOW_NETFLOW_IPV4_PORT | The UDP port on which to listen for Netflow messages | 2055 |
| ELASTIFLOW_NETFLOW_IPV6_HOST | The IP address on which to listen for Netflow messages | [::] |
| ELASTIFLOW_NETFLOW_IPV6_PORT | The UDP port on which to listen for Netflow messages | 52055 |
| ELASTIFLOW_NETFLOW_UDP_WORKERS | The number of Netflow input threads | 4 |
| ELASTIFLOW_NETFLOW_UDP_QUEUE_SIZE | The number of unprocessed Netflow UDP packets the input can buffer | 4096 |
| ELASTIFLOW_NETFLOW_LASTSW_TIMESTAMP | Enable/Disable setting @timestamp with the value of netflow.last_switched |
false |
| ELASTIFLOW_NETFLOW_TZ | The timezone of netflow.last_switched | UTC |
| ELASTIFLOW_SFLOW_IPV4_HOST | The IP address on which to listen for sFlow messages | 0.0.0.0 |
| ELASTIFLOW_SFLOW_IPV4_PORT | The UDP port on which to listen for sFlow messages | 6343 |
| ELASTIFLOW_SFLOW_IPV6_HOST | The IP address on which to listen for sFlow messages | [::] |
| ELASTIFLOW_SFLOW_IPV6_PORT | The UDP port on which to listen for sFlow messages | 56343 |
| ELASTIFLOW_SFLOW_UDP_WORKERS | The number of sFlow input threads | 4 |
| ELASTIFLOW_SFLOW_UDP_QUEUE_SIZE | The number of unprocessed sFlow UDP packets the input can buffer | 4096 |
| ELASTIFLOW_IPFIX_TCP_IPV4_HOST | The IP address on which to listen for IPFIX messages via TCP | 0.0.0.0 |
| ELASTIFLOW_IPFIX_TCP_IPV4_PORT | The port on which to listen for IPFIX messages via TCP | 4739 |
| ELASTIFLOW_IPFIX_UDP_IPV4_HOST | The IP address on which to listen for IPFIX messages via UDP | 0.0.0.0 |
| ELASTIFLOW_IPFIX_UDP_IPV4_PORT | The port on which to listen for IPFIX messages via UDP | 4739 |
| ELASTIFLOW_IPFIX_TCP_IPV6_HOST | The IP address on which to listen for IPFIX messages via TCP | [::] |
| ELASTIFLOW_IPFIX_TCP_IPV6_PORT | The port on which to listen for IPFIX messages via TCP | 54739 |
| ELASTIFLOW_IPFIX_UDP_IPV6_HOST | The IP address on which to listen for IPFIX messages via UDP | [::] |
| ELASTIFLOW_IPFIX_UDP_IPV6_PORT | The port on which to listen for IPFIX messages via UDP | 54739 |
| ELASTIFLOW_IPFIX_UDP_WORKERS | The number of IPFIX input threads | 4 |
| ELASTIFLOW_IPFIX_UDP_QUEUE_SIZE | The number of unprocessed IPFIX UDP packets the input can buffer | 4096 |
I recommend configuring timepicker:quickRanges for the setting below. The result will look like this:

[
  {
    "from": "now/d",
    "to": "now/d",
    "display": "Today",
    "section": 0
  },
  {
    "from": "now/w",
    "to": "now/w",
    "display": "This week",
    "section": 0
  },
  {
    "from": "now/M",
    "to": "now/M",
    "display": "This month",
    "section": 0
  },
  {
    "from": "now/d",
    "to": "now",
    "display": "Today so far",
    "section": 0
  },
  {
    "from": "now/w",
    "to": "now",
    "display": "Week to date",
    "section": 0
  },
  {
    "from": "now/M",
    "to": "now",
    "display": "Month to date",
    "section": 0
  },
  {
    "from": "now-15m",
    "to": "now",
    "display": "Last 15 minutes",
    "section": 1
  },
  {
    "from": "now-30m",
    "to": "now",
    "display": "Last 30 minutes",
    "section": 1
  },
  {
    "from": "now-1h",
    "to": "now",
    "display": "Last 1 hour",
    "section": 1
  },
  {
    "from": "now-2h",
    "to": "now",
    "display": "Last 2 hours",
    "section": 1
  },
  {
    "from": "now-4h",
    "to": "now",
    "display": "Last 4 hours",
    "section": 2
  },
  {
    "from": "now-12h",
    "to": "now",
    "display": "Last 12 hours",
    "section": 2
  },
  {
    "from": "now-24h",
    "to": "now",
    "display": "Last 24 hours",
    "section": 2
  },
  {
    "from": "now-48h",
    "to": "now",
    "display": "Last 48 hours",
    "section": 2
  },
  {
    "from": "now-7d",
    "to": "now",
    "display": "Last 7 days",
    "section": 3
  },
  {
    "from": "now-30d",
    "to": "now",
    "display": "Last 30 days",
    "section": 3
  },
  {
    "from": "now-60d",
    "to": "now",
    "display": "Last 60 days",
    "section": 3
  },
  {
    "from": "now-90d",
    "to": "now",
    "display": "Last 90 days",
    "section": 3
  }
]
This product includes GeoLite2 data created by MaxMind, available from (http://www.maxmind.com)