![]()
A python library for creating visualisations related to process mining, all graphs are generated using matplotlib.
This package provides an interface for making exciting visualisations about process mining. Process mining can be a purely technical endeavour at times, and having an easy way to visualise concepts is essential. To encourage others to overcome the technical components of process mining, sometimes having an engaging animation will do just that. A key difference between other data science domains and process mining, is that process mining outcomes often will have a visual interpretation that others don’t. We need more ways to emphasise this aspect, and this project is one such way.
The goal of vispm is to:
- Have fun and create some cool stuff.
- Make exciting process mining visualisation that would aspire others.
- Create a layered interface supporting three levels: quick-easy access, general templates for specific use cases, super customisation via class objects.
Here is a list of supported process mining visualisations:
This chart is the only visualisation available within the project so far. In this visualisation, we plot events across a time axis, and we can change how events are coloured depending on the type analysis. We currently support colouring events via trace or event label but offer a template for customer colourers.
This section is currently being worked on and is unstable.
Below is an example of generating a dotted chart from an event log. While we do not require that you use pm4py as the importer, we suggest you use the library to handle xes or xes.gz files. The StaticDottedChartPresentor has several optional parameters that allow users to change the type of colourer used (trace, event label or custom), figure parameters (dpi, size, markersize) and the colourmap used for colouring. See the doc string for more information.
from vispm import StaticDottedChartPresentor
from matplotlib import pyplot as plt

# not required but a very helpful and cool library
from pm4py import read_xes

from os.path import join

LOG_FILE = join(".","BPI_Challenge_2012.xes.gz")

def main():
    log = read_xes(LOG_FILE)
    presentor = StaticDottedChartPresentor(log)
    presentor.plot()
    plt.show()

if __name__ == "__main__":
    main()
Below are some examples of using this class and playing around with custom colourers.


Below are some examples of extensions that can be added to this extension before ploting.
This extension plots a histogram based on the events within a dotted chart. Events will be broken down by colour for each bin.
from vispm import StaticDottedChartPresentor,DottedColourHistogramExtension

presentor = StaticDottedChartPresentor(log,dpi=100,
    event_colour_scheme=StaticDottedChartPresentor.EventColourScheme.EventLabel,
    colormap=HIGH_CONTRAST_COOL
)
ext = DottedColourHistogramExtension(direction=DottedColourHistogramExtension.Direction.NORTH)
presentor.add_extension(ext)
ext = DottedColourHistogramExtension(direction=DottedColourHistogramExtension.Direction.SOUTH,
         bin_axes=DottedColourHistogramExtension.PlotAxes.X)
presentor.add_extension(ext)
ext = DottedColourHistogramExtension(direction=DottedColourHistogramExtension.Direction.WEST)
presentor.add_extension(ext)
ext = DottedColourHistogramExtension(direction=DottedColourHistogramExtension.Direction.EAST,
         bin_axes=DottedColourHistogramExtension.PlotAxes.X)
presentor.add_extension(ext)
presentor.plot()

This extension plots a histogram based on the events within a dotted chart. Events will be broken down by the label for each event in each bin. This extension uses a colour imputer that is independent of the graph, meaning different colour schemes can be used for each extension.
- setup up colour schemes to use
from vispm.helpers.colours.colourmaps import HIGH_CONTRAST_COOL,HIGH_CONTRAST_WARM
from vispm.helpers.colours.colourmaps import EARTH,COOL_WINTER,

import numpy as np
from matplotlib.colors import ListedColormap
from matplotlib.cm import get_cmap

colourmaps = [COOL_WINTER,EARTH,HIGH_CONTRAST_COOL,HIGH_CONTRAST_WARM]
seq_colourmap = np.vstack(
    (
    colourmaps[0](np.linspace(0.20,1,8)),
    colourmaps[1](np.linspace(0.20,1,8)),
    colourmaps[2](np.linspace(0.20,1,8)),
    colourmaps[3](np.linspace(0.20,1,8))
    )
)
seq_colourmap = ListedColormap(seq_colourmap, name='VARIANCE')
cmap = get_cmap(HIGH_CONTRAST_COOL, 26)- create a presentor and add extensions
presentor = StaticDottedChartPresentor(log,dpi=100,
    event_colour_scheme=StaticDottedChartPresentor.EventColourScheme.EventLabel,
    colormap=cmap
)

ext = DottedEventHistogramExtension(
    direction=DottedEventHistogramExtension.Direction.SOUTH,
    bin_axes=DottedEventHistogramExtension.PlotAxes.X,
    colourmap=seq_colourmap
)
presentor.add_extension(ext)
ext = DottedEventHistogramExtension(
    direction=DottedEventHistogramExtension.Direction.NORTH,
    bin_axes=DottedEventHistogramExtension.PlotAxes.Y,
    colourmap=seq_colourmap
)
presentor.add_extension(ext)
ext = DottedEventHistogramExtension(
    direction=DottedEventHistogramExtension.Direction.WEST,
    bin_axes=DottedEventHistogramExtension.PlotAxes.Y,
    colourmap=cmap
)
presentor.add_extension(ext)
ext = DottedEventHistogramExtension(
    direction=DottedEventHistogramExtension.Direction.EAST,
    bin_axes=DottedEventHistogramExtension.PlotAxes.X,
    colourmap=cmap
)
presentor.add_extension(ext)

presentor.plot()
This extension describes an aspect of the event log. For example, a breakdown of trace duration, or trace length (by the number of activities), or event label, or when events occur (weekday or monthday).
The following example shows how to use this extension to understand the properties of event log, alongside a dotted chart.
cmap = get_cmap(HIGH_CONTRAST_COOL, 26)
presentor = StaticDottedChartPresentor(log,dpi=100,
    event_colour_scheme=StaticDottedChartPresentor.EventColourScheme.EventLabel,
    colormap=cmap
)

ext = DescriptionHistogramExtension(
)
presentor.add_extension(ext)

ext = DescriptionHistogramExtension(
    direction=DescriptionHistogramExtension.Direction.EAST,
    describe=DescriptionHistogramExtension.Describe.TraceLength,
    density=DescriptionHistogramExtension.Density.Event
)
presentor.add_extension(ext)

ext = DescriptionHistogramExtension(
    direction=DescriptionHistogramExtension.Direction.SOUTH,
    describe=DescriptionHistogramExtension.Describe.TraceDuration,
    density=DescriptionHistogramExtension.Density.Trace
)
presentor.add_extension(ext)

ext = DescriptionHistogramExtension(
    direction=DescriptionHistogramExtension.Direction.WEST,
    describe=DescriptionHistogramExtension.Describe.Monthday,
    density=DescriptionHistogramExtension.Density.Event
)
presentor.add_extension(ext)

presentor.plot()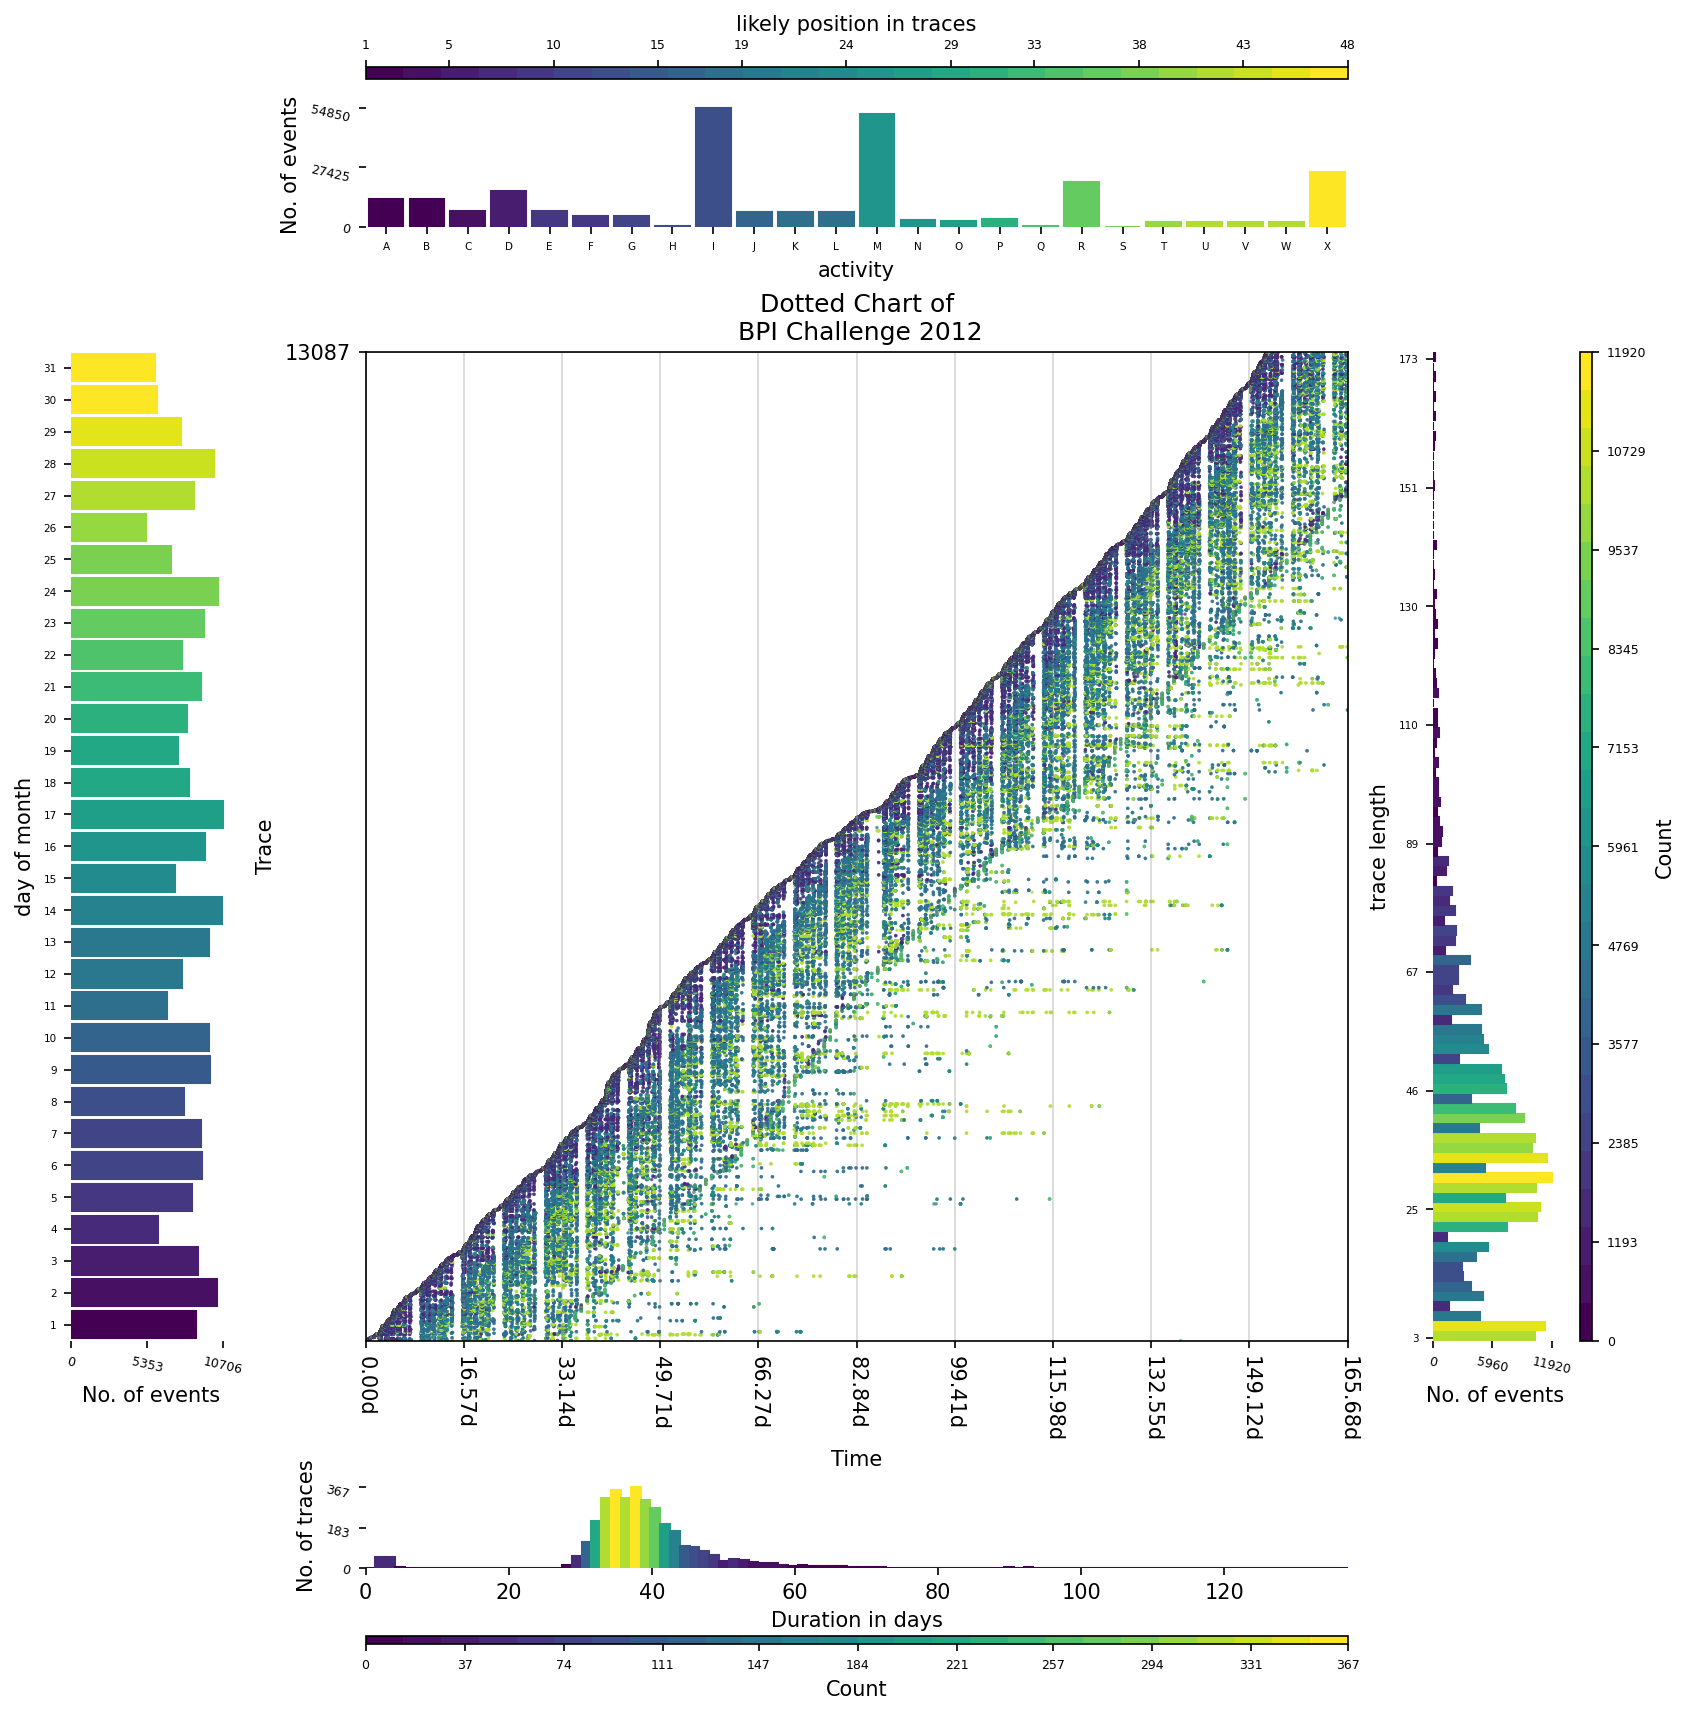
More on these in upcoming updates.
More on these in upcoming updates.
The source code is currently available on GitHub: https://github.com/AdamBanham/vispm
Installers for the latest released versions are available at the Python Package Index (PyPI): https://pypi.org/project/vispm/
To install the package, use the following command.
pip install vispm


