Type of chart to create (current options are 'bubble' and 'bubbleScatter')
htmlAnchorID
string
ID of the div where AC-D3 will append the visualization
diameter
number
Overall diameter of the visualization in pixels
zoom
number
Zoom level of each of the videos
resolutionThresholds
array
This sets the bounds for which video resolution to use depending on height of the video (in pixels)
autoplay
boolean
This specifies whether the videos will begin playing automatically or not
loop
boolean
This specifies whether videos will start over again, every time it is finished
onDoubleClick
string
This specifies which event handler to invoke on dblclick (current options are 'openNewWindow', a function that opens the video in a new window, and 'expandBubble', a function that expands the size of the bubbe to fill the entire visualization)
Type of chart to create (current options are 'bubble' and 'bubbleScatter')
htmlAnchorID
string
ID of the div where AC-D3 will append the visualization
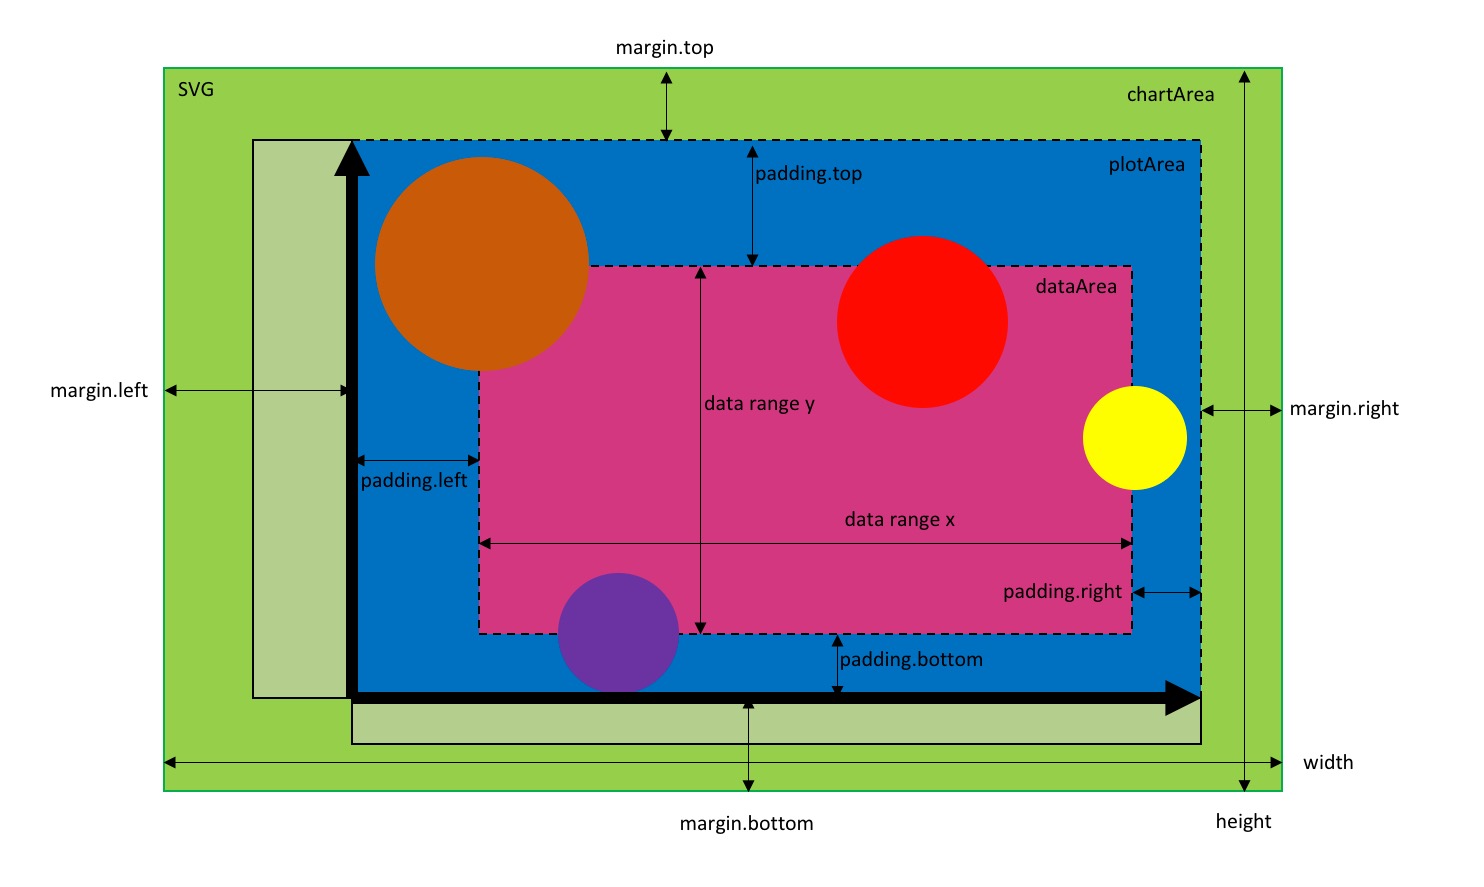
height
number
Overall height of the visualization in pixels
width
number
Overall width of the visualization in pixels
zoom
number
Zoom level of each of the videos
resolutionThresholds
array
This sets the bounds for which video resolution to use depending on height of the video (in pixels)
autoplay
boolean
This specifies whether the videos will begin playing automatically or not
loop
boolean
This specifies whether videos will start over again, every time it is finished
onDoubleClick
string
This specifies which event handler to invoke on dblclick (current options are 'openNewWindow', a function that opens the video in a new window, and 'expandBubble', a function that expands the size of the bubbe to fill the entire visualization)
dateFormat
string
This specifies the date format used
xIsDate
boolean
This specifies whether the data for the x position is a date
yIsDate
boolean
This specifies whether the data for the y position is a date
rIsDate
boolean
This specifies whether the data for the r dimension is a date