abhayspawar / featexp Goto Github PK
View Code? Open in Web Editor NEWFeature exploration for supervised learning
License: MIT License
Feature exploration for supervised learning
License: MIT License


dtrain = xgb.DMatrix(X_test, label=y_test, missing=np.nan)
dtest = xgb.DMatrix(X_train, label=y_train, missing=np.nan)
The X_test is for dtrain not X_train?? Is there anything wrong?
I am getting this error using get_trend_stats()
ValueError Traceback (most recent call last)
in ()
----> 1 stats = get_trend_stats(data=train, target_col='CANTIDAD_DIR_REP_BIG_RT', data_test=test)
2 stats~/anaconda3/lib/python3.6/site-packages/featexp/base.py in get_trend_stats(data, target_col, features_list, bins, data_test)
247 ignored.append(feature)
248 else:
--> 249 cuts, grouped = get_grouped_data(input_data=data, feature=feature, target_col=target_col, bins=bins)
250 trend_changes = get_trend_changes(grouped_data=grouped, feature=feature, target_col=target_col)
251 if has_test:~/anaconda3/lib/python3.6/site-packages/featexp/base.py in get_grouped_data(input_data, feature, target_col, bins, cuts)
36 # if reduced_cuts>0:
37 # print('Reduced the number of bins due to less variation in feature')
---> 38 print(cuts)
39 cut_series = pd.cut(input_data[feature], cuts)
40 else:~/anaconda3/lib/python3.6/site-packages/pandas/core/reshape/tile.py in cut(x, bins, right, labels, retbins, precision, include_lowest, duplicates)
226 bins = _convert_bin_to_numeric_type(bins, dtype)
227 if (np.diff(bins) < 0).any():
--> 228 raise ValueError('bins must increase monotonically.')
229
230 fac, bins = _bins_to_cuts(x, bins, right=right, labels=labels,ValueError: bins must increase monotonically.
I checked cuts value and this is its content:
[475836.1, 897023.3999999999, 1256710.22, 1334681.24, 1838614.84, 1838614.8399999999, 3230684.84]
So it seems there is a bug since two cuts have the same value!
Hello,
It is not clear for me if this package can be applied to binary classification problems. Can you clarify?
If possible, what is the average of a target in a binary class problem?
Thank you
Is this project still maintained?
Thanks
Great package. I have some issues when running !pip install featexp in google Colab.
I get the following messages:
ERROR: google-colab 1.0.0 has requirement pandas~=0.24.0, but you'll have pandas 0.23.4 which is incompatible.
ERROR: datascience 0.10.6 has requirement folium==0.2.1, but you'll have folium 0.8.3 which is incompatible.
ERROR: albumentations 0.1.12 has requirement imgaug<0.2.7,>=0.2.5, but you'll have imgaug 0.2.9 which is incompatible.
Successfully installed featexp-0.0.5 matplotlib-3.0.2 numpy-1.15.4 pandas-0.23.4
WARNING: The following packages were previously imported in this runtime:
[matplotlib,mpl_toolkits,numpy,pandas]
You must restart the runtime in order to use newly installed versions.
As a consequence (I believe) commands like dataframe.head() no longer work.
FileNotFoundErrorTraceback (most recent call last)
in ()
----> 1 X_train, X_test, y_train, y_test, train_users, test_users = import_and_create_train_test_data()
.....(blablabla)
FileNotFoundError: File b'demo/data/application_train.csv' does not exist
why? any knows how to solve?
When I run get_trend_stats I get the following warning multiple times:
featexp/base.py:23: SettingWithCopyWarning
A value is trying to be set on a copy of a slice from a DataFrame.
Try using .loc[row_indexer,col_indexer] = value instead
The origin of the problem is the fact that get_grouped_data changes its input dataframe. It might be better to copy the input data before doing anything with it.
Setup:
Hi again Abhay,
I ended up locally playing with the library since it was not allowing manipulation of the output figures (like changing resolution and saving pdf outputs as opposed to png). It is quite a quick fix I think, just need to restructure a bit the draw_plots function.
Hey,
What am I doing wrong here?
https://cl.ly/466adfd96d75 I am using the dataset in the article on credit risk.
Thanks,
I meet this problem: ValueError: missing values must be missing in the same location both left and right sides. Can you help me solve this wrong? Thank you very much
在get_dataloader.py中,定义test_name='testb',但原始test数据文件夹里(百度云下载的),数据文件前缀都是test_a,没有testb开头的,代码执行时会报文件找不到的错误
还有在main_LR.py的load_dataset中,也是‘/test/testb_base.csv'这样的引用,,但并没有testb这种数据
请问这个testb是否实际是指test_a这样开头的文件?谢谢!
Hi Abhay,
I appreciate your great effort on publishing your code. I wonder if there is a way to implement weights for each data point since this is often the case in my domain. Thanks.
Cheers,
Rui
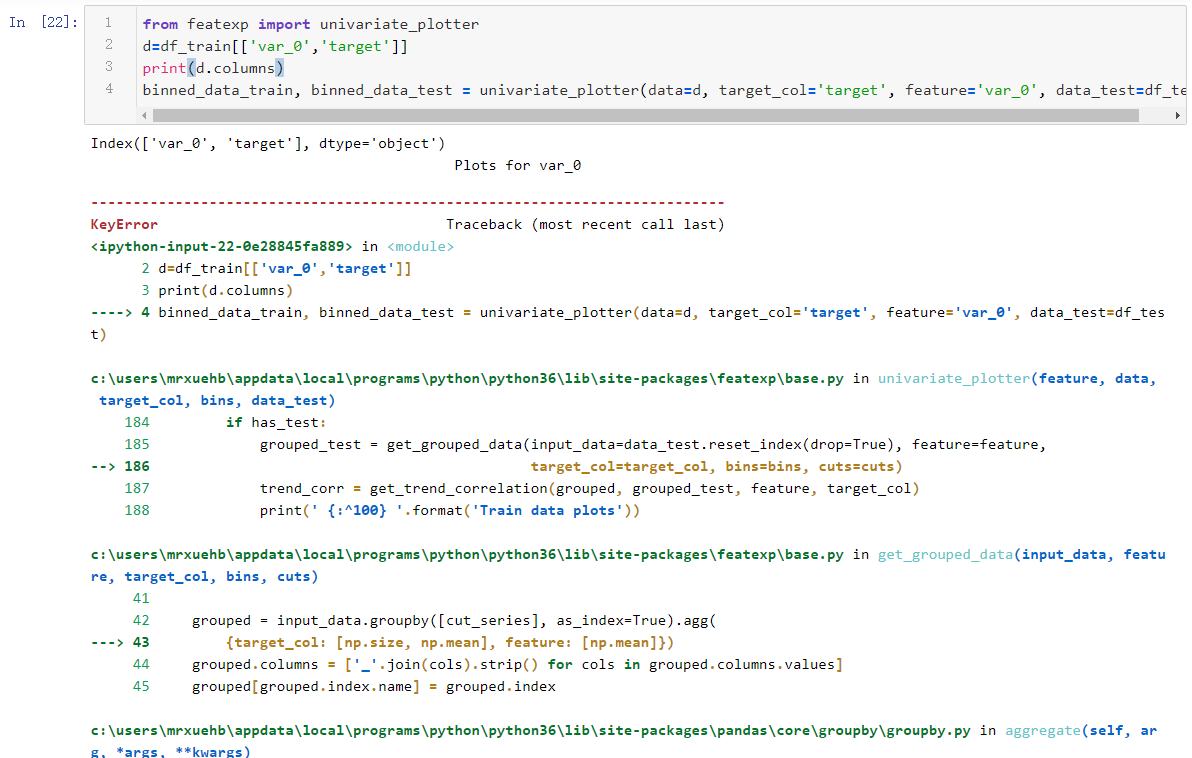
Hello, I am trying to use this wonderful tool, but the error occurs as 'KeyError: "Column 'target' does not exist!"'. I am pretty sure that 'target' is in train data as a column.
Could you help me with this? Many thanks.

It seems that numpy matplotlib 's version maybe a little old?

First, thanks for developing this package. I tried the "get_univariate_plots" function and it worked but I can not import the "get_trend_stats_feature" function. Do you have ideas?
Getting this error again and again while executing the command:
stats = get_trend_stats(data=data_train, target_col='target', data_test=data_split[0])
Hello,
I forked the repo today to be able to use it with newer versions of the required libraries.
btw, it worked with:
numpy==1.17.4
pandas==0.25.3
matplotlib==3.0.2
Also, I did some cosmetic changes which I tried to add with a PR, but I guess you are not allowing them? I am getting the following error:
remote: Permission to abhayspawar/featexp.git denied to pauroger.
fatal: unable to access 'https://github.com/abhayspawar/featexp.git/': The requested URL returned error: 403
AS the function get_univariate_plots says, the bins should be equal frequency, but many plots in featexp_demo.ipynb behave the opposite, for example, 'Plots for CNT_CHILDREN'、'Plots for AMT_INCOME_TOTAL'
train_test_split =0.3, there is no problem. But when set the ratio is 0.25 or 0.5, something is wrong.

I am on python 3.6 and pip installed featexp and it cannot import - i am getting a ModuleNotFoundError
I think there could add an new function like "get_grouped_data" by using Decision Tree to give the best bins for users.
Thank you very much for putting together a nice library. Would there be a better way of citing featexp than this repository?
A declarative, efficient, and flexible JavaScript library for building user interfaces.
🖖 Vue.js is a progressive, incrementally-adoptable JavaScript framework for building UI on the web.
TypeScript is a superset of JavaScript that compiles to clean JavaScript output.
An Open Source Machine Learning Framework for Everyone
The Web framework for perfectionists with deadlines.
A PHP framework for web artisans
Bring data to life with SVG, Canvas and HTML. 📊📈🎉
JavaScript (JS) is a lightweight interpreted programming language with first-class functions.
Some thing interesting about web. New door for the world.
A server is a program made to process requests and deliver data to clients.
Machine learning is a way of modeling and interpreting data that allows a piece of software to respond intelligently.
Some thing interesting about visualization, use data art
Some thing interesting about game, make everyone happy.
We are working to build community through open source technology. NB: members must have two-factor auth.
Open source projects and samples from Microsoft.
Google ❤️ Open Source for everyone.
Alibaba Open Source for everyone
Data-Driven Documents codes.
China tencent open source team.