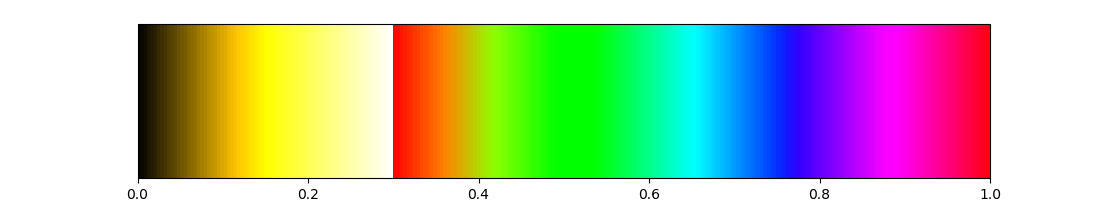
A simple tool to manipulate matplotlib colormaps easily.
Currently, vanadis can concatenate and slice colormaps. And it is compatible with
matplotlib built-in colormaps.
from vanadis.colormap import Colormap
import matplotlib.pyplot as plt
from matplotlib.colorbar import ColorbarBase
cdict = {'red':[(0.0, 0.0, 0.0),
                (0.5, 1.0, 1.0),
                (1.0, 1.0, 1.0)],
        'green':[(0.0, 0.0, 0.0),
                 (0.5, 1.0, 1.0),
                 (1.0, 1.0, 1.0)],
        'blue':[(0.0, 0.0, 0.0),
                (0.5, 0.0, 0.0),
                (1.0, 1.0, 1.0)]}
cmap = Colormap('a', cdict)
hsv = plt.get_cmap('hsv')
# Use indexing or adding to create new cmap !
new_cmap = cmap[0:3] + hsv
plt.figure(1, figsize=(11, 2))
ax = plt.gca()
ColorbarBase(ax, cmap=new_cmap, orientation='horizontal')
plt.show()
It should look like this: