Comments (6)
 HeikoPaulheim
commented on May 29, 2024
3
HeikoPaulheim
commented on May 29, 2024
3
Thanks @mberr! With these changes, I also got it to converge :-)
from pykeen.
 mberr
commented on May 29, 2024
mberr
commented on May 29, 2024
Hi @HeikoPaulheim,
first of all thank you for your interest in knowledge graph embeddings and our library in particular!
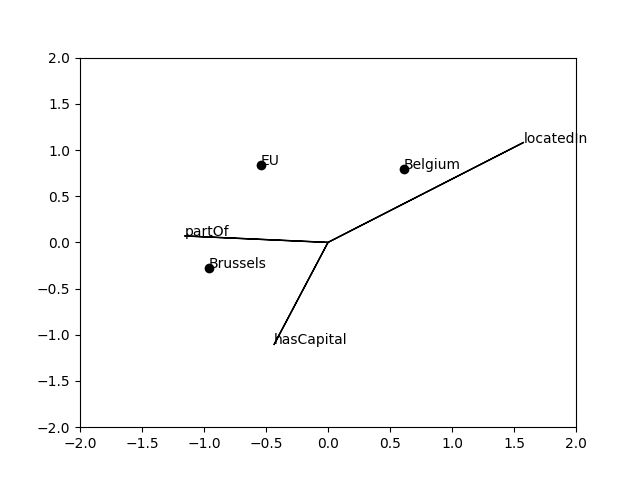
The result looks indeed unexpected, but I can see a few possible reasons for it:
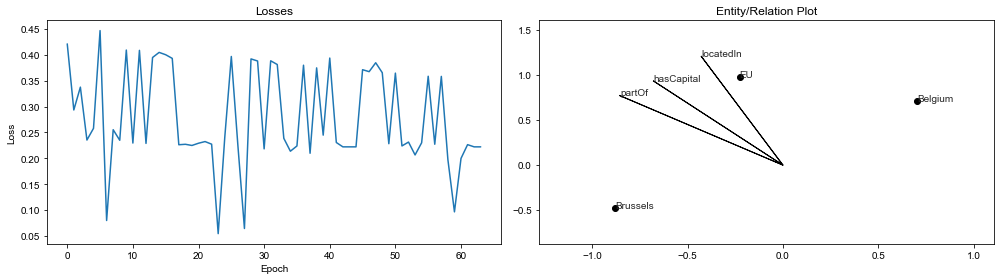
- The model is not converged. To check this, could you please take a look at the losses history? You can do so e.g. by
from matplotlib import pyplot as plt
plt.plot(result.losses)

# Or, if you want to use our builtin plot method for this
result.plot_losses()
*addition from @cthoyt, there's actually a convenience function for this already :) I added it in the above code block under the Or, ....
Does the loss decrease? If not, you may need to tune some parameters, e.g. the optimizer's learning rate, or the number of epochs you train the model. You can do so by passing custom optimizer_kwargs and training_kwargs to the pipeline, e.g.
result = pipeline(
    training_triples_factory=tf,
    testing_triples_factory=tf,
    model='TransE',
    model_kwargs=dict(embedding_dim=2),
    random_seed=1,
    device='cpu',
    optimizer_kwargs=dict(lr=1.0e-01),
    training_kwargs=dict(num_epochs=1024),
)
As a general rule of thumb, increase the number of epochs until you observe some form of convergence. Start with a large learning rate. It you observe divergence, decrease the learning rate. Please notice that there is some stochasticity in the training, since we sample negative examples for positive ones. Thus, the loss may fluctuate naturally. To better see the trend, you can smooth the loss by averaging over a window of epochs.
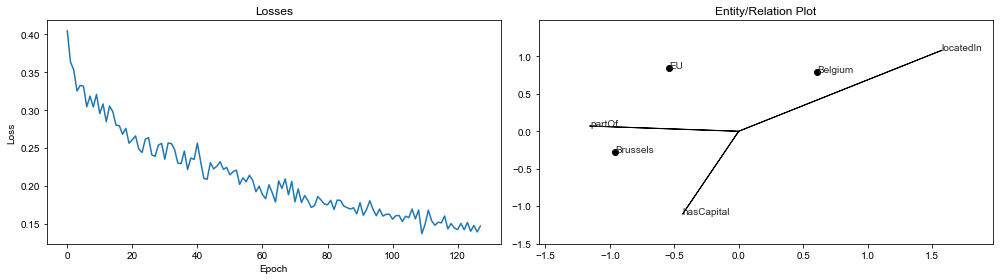
- We use a margin-based loss with TransE by default. Thus, it suffices if the model predicts scores such that the scores of positive triples and negative triples are at least one margin apart. Once the model has reached this state, if will not improve further upon these examples, as the embeddings are "good enough". Hence, an optimal solution with margin-based loss might not look like the exact geometric solution. If you want to change that you can switch to a loss function which does not use a margin, e.g. the softplus loss. You can do this by passing
loss="softplus"to the pipeline, e.g.
result = pipeline(
    training_triples_factory=tf,
    testing_triples_factory=tf,
    model='TransE',
    model_kwargs=dict(embedding_dim=2),
    random_seed=1,
    device='cpu',
    loss='softplus',
)
When applying both changes, I obtain a result which is closer to what you would expect.
from pykeen.pipeline import pipeline

result = pipeline(
    training_triples_factory=tf,
    testing_triples_factory=tf,
    model='TransE',
    model_kwargs=dict(embedding_dim=2),
    random_seed=1,
    device='cpu',
    loss='softplus',
    optimizer_kwargs=dict(lr=1.0e-01),
    training_kwargs=dict(num_epochs=128),
)
from pykeen.
 cthoyt
commented on May 29, 2024
cthoyt
commented on May 29, 2024
@mberr will you add a PR with the code for generating that plot? I'm sure other people will find it useful!
from pykeen.
mberr
commented on May 29, 2024
@mberr will you add a PR with the code for generating that plot? I'm sure other people will find it useful!
The loss plot is already in the repository, although I re-implemented it 🙈
As for the second plot, its usage seems to be restricted to this toy example, as long as we do not use some dimensionality reduction strategy to project the embedding space into two dimensions.
Moreover, the relation arrow heads somehow got lost in my plot compared to @HeikoPaulheim 's version.
Here is the code used to reproduce my second plot:
from matplotlib import pyplot as plt

# draw entities
e_emb = result.model.entity_embeddings.weight.detach().numpy()
e_id_to_label = {
    eid: el
    for el, eid in tf.entity_to_id.items()
}
for i, e in enumerate(e_emb):
    plt.scatter(*e, color='black')
    plt.annotate(e_id_to_label[i], e)

# draw relations
r_emb = result.model.relation_embeddings.weight.detach().numpy()
r_id_to_label = {
    rid: rl
    for rl, rid in tf.relation_to_id.items()
}
for i, r in enumerate(r_emb):
    plt.arrow(0, 0, *r)
    plt.annotate(r_id_to_label[i], r)
from pykeen.
mberr
commented on May 29, 2024
As an additional information: The default value of num_epochs is 5, which might be more appropriate for larger datasets than for smaller ones.
Line 789 in 852e25e
from pykeen.
cthoyt
commented on May 29, 2024
In #99, I've built on @mberr's code as well as implemented the functionality for generating this plot for arbitrarily large entity and relation embeddings using a choice of dimensionality reduction techniques that come with sklearn (e.g., PCA, KPCA, Gaussian Process). It also comes with a user-facing function PipelineResult.plot() that does all the hard work and makes this:
There's a demo notebook here with the toy example: https://github.com/pykeen/pykeen/blob/add-entity_plot/notebooks/Pipeline%20Plots%20Demo.ipynb. @mberr @HeikoPaulheim could you suggest tweaks to make it converge and get the desired results? Update: I forgot to copy the loss='softplus', even after @mberr wrote up such a nice explanation of why this was important. Now it's looking much nicer as of 18abc44.
from pykeen.
Related Issues (20)
- AttributeError: 'Module' object has no attribute 'get' HOT 2
- Question about the use of `create_inverse_triples` HOT 2
- Want to train a model without any evaluate or test dataset HOT 1
- Bug in wandb result tracker HOT 1
- Possible issue with model evaluation when using datasets with inverse triples HOT 1
- RGCN RuntimeError: trying to backward through graph a second time. (has parameters but no reset_parameters) HOT 2
- QuatE: GPU memory is not released per epoch HOT 3
- Training loop does not update relation representations when continuing training HOT 2
- from pykeen.pipeline import pipeline, pipeline issue HOT 3
- Evaluating metrics on many subsets with multiple models HOT 2
- Shape Mismatch upon initializing pretrained ComplEx embeddings HOT 2
- TransE - CUDA out of memory HOT 3
- Importing model_resolver HOT 2
- Getting Embeddings of the Entity and Relations HOT 13
- RGCN Hyper parameter optimization error HOT 1
- MatKG HOT 1
- HPO_Pipeline fails on AutoSF models HOT 1
- Unable to reproduce TransE experiment
- EarlyStopper: show progress bar
- Cosine Annealing with Warm Restart LR Scheduler recieving an unexpected kwarg `T_i` HOT 1
Recommend Projects
-
 React
React
A declarative, efficient, and flexible JavaScript library for building user interfaces.
-
Vue.js
🖖 Vue.js is a progressive, incrementally-adoptable JavaScript framework for building UI on the web.
-
 Typescript
TypeScript is a superset of JavaScript that compiles to clean JavaScript output.
-
TensorFlow
An Open Source Machine Learning Framework for Everyone
-
Django
The Web framework for perfectionists with deadlines.
-
 Laravel
A PHP framework for web artisans
-
D3
Bring data to life with SVG, Canvas and HTML. 📊📈🎉
-
Recommend Topics
-
javascript
JavaScript (JS) is a lightweight interpreted programming language with first-class functions.
-
web
Some thing interesting about web. New door for the world.
-
server
A server is a program made to process requests and deliver data to clients.
-
Machine learning
Machine learning is a way of modeling and interpreting data that allows a piece of software to respond intelligently.
-
Visualization
Some thing interesting about visualization, use data art
-
Game
Some thing interesting about game, make everyone happy.
Recommend Org
-
Facebook
We are working to build community through open source technology. NB: members must have two-factor auth.
-
Microsoft
Open source projects and samples from Microsoft.
-
Google
Google ❤️ Open Source for everyone.
-
Alibaba
Alibaba Open Source for everyone
-
D3
Data-Driven Documents codes.
-
Tencent
China tencent open source team.
from pykeen.