Git Product home page Git Product logo

neovis.js's Introduction

neovis.js

Actions Build Statusnpm version

Graph visualizations powered by vis.js with data from Neo4j.

Features

  • Connect to Neo4j instance to get live data
  • User specified labels and property to be displayed
  • User specified Cypher query to populate
  • Specify node property for url of image for node
  • Specify edge property for edge thickness
  • Specify node property for community / clustering
  • Specify node property for node size
  • Configure popover

Install

Neovis.js can be installed via npm:

npm install --save neovis.js

you can also obtain neovis.js via CDN:

CDN

For ease of use Neovis.js can be obtained from Neo4jLabs CDN:

Most recent release

<script src="https://unpkg.com/[email protected]"></script>

Version without neo4j-driver dependency

<script src="https://unpkg.com/[email protected]/dist/neovis-without-dependencies.js"></script>

Quickstart Example

Let's go through the steps to reproduce this visualization:

Prepare Neo4j

Start with a blank Neo4j instance, or spin up a blank Neo4j Sandbox. We'll load the Game of Thrones dataset, run:

LOAD CSV WITH HEADERS FROM 'https://raw.githubusercontent.com/mathbeveridge/asoiaf/master/data/asoiaf-all-edges.csv'
AS row
MERGE (src:Character {name: row.Source})
MERGE (tgt:Character {name: row.Target})
MERGE (src)-[r:INTERACTS]->(tgt)
  ON CREATE SET r.weight = toInteger(row.weight)

We've pre-calculated PageRank and ran a community detection algorithm to assign community ids for each Character. Let's load those next:

LOAD CSV WITH HEADERS FROM 'https://raw.githubusercontent.com/johnymontana/neovis.js/master/examples/data/got-centralities.csv'
AS row
MATCH (c:Character {name: row.name})
SET c.community = toInteger(row.community),
c.pagerank = toFloat(row.pagerank)

Our graph now consists of Character nodes that are connected by an INTERACTS relationships. We can visualize the whole graph in Neo4j Browser by running:

MATCH p = (:Character)-[:INTERACTS]->(:Character)
RETURN p

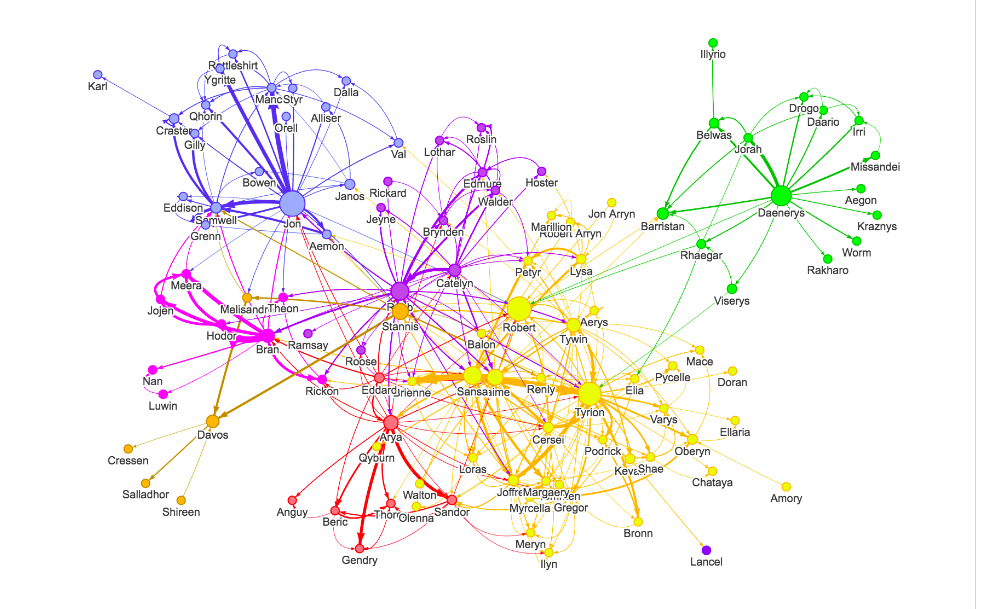
We can see characters that are connected and with the help of the force directed layout we can begin to see clusters in the graph. However, we want to visualize the centralities (PageRank) and community detection results that we also imported.

Specifically we would like:

  • Node size to be proportional to the Character's pagerank score. This will allow us to quickly identify important nodes in the network.
  • Node color to determined by the community property. This will allow us to visualize clusters.
  • Relationship thickeness should be proportional to the weight property on the INTERACTS relationship.

Neovis.js, by combining the JavaScript driver for Neo4j and the vis.js visualization library will allow us to build this visualization.

index.html

Create a new html file:

<!doctype html>
<html>
<head>
    <title>Neovis.js Simple Example</title>
    <style type="text/css">
        html, body {
            font: 16pt arial;
        }

        #viz {
            width: 900px;
            height: 700px;
            border: 1px solid lightgray;
            font: 22pt arial;
        }
    </style>
</head>
<body onload="draw()">
<div id="viz"></div>
</body>
</html>

We define some basic CSS to specify the boundaries of a div and then create a single div in the body. We also specify onload="draw()" so that the draw() function is called as soon as the body is loaded.

We need to pull in neovis.js:

<script src="https://unpkg.com/[email protected]"></script>

And define our draw() function:

<script type="text/javascript">

    let neoViz;

    function draw() {
        const config = {
            containerId: "viz",
            neo4j: {
                serverUrl: "bolt://localhost:7687",
                serverUser: "neo4j",
                serverPassword: "sorts-swims-burglaries",
            },
            labels: {
                Character: {
                    label: "name",
                    value: "pagerank",
                    group: "community",
                    [NeoVis.NEOVIS_ADVANCED_CONFIG]: {
                        function: {
                            title: (node) => viz.nodeToHtml(node, [
                                "name",
                                "pagerank"
                            ])
                        }
                    }
                }
            },
            relationships: {
                INTERACTS: {
                    value: "weight"
                }
            },
            initialCypher: "MATCH (n)-[r:INTERACTS]->(m) RETURN *"
        };

        neoViz = new NeoVis.default(config);
        neoViz.render();
    }
</script>

This function creates a config object that specifies how to connect to Neo4j, what data to fetch, and how to configure the visualization.

See simple-example.html for the full code.

module usage

you can also use it as module, but it would require you have a way to import css files

import NeoVis from 'neovis.js';

or you can import the version with bundled dependency

import NeoVis from 'neovis.js/dist/neovis.js';

Api Reference

Api Reference

Build

This project uses git submodules to include the dependencies for neo4j-driver and vis.js. This project uses webpack to build a bundle that includes all project dependencies. webpack.config.js contains the configuration for webpack. After cloning the repo:

npm install
npm run build
npm run typedoc

will build dist/neovis.js and dist/neovis-without-dependencies.js

neovis.js's People

Contributors

bluejoe2008 avatar dependabot[bot] avatar dukesun99 avatar greenrover avatar jexp avatar johnymontana avatar kenkeiras avatar loneamarok72 avatar nikopeltoniemi avatar nuromirzak avatar thebestnom avatar

Stargazers

 avatar  avatar  avatar  avatar  avatar  avatar  avatar  avatar  avatar  avatar  avatar  avatar  avatar  avatar  avatar  avatar  avatar  avatar  avatar  avatar  avatar  avatar  avatar  avatar  avatar  avatar  avatar  avatar  avatar  avatar  avatar  avatar  avatar  avatar  avatar  avatar  avatar  avatar  avatar  avatar  avatar  avatar  avatar  avatar  avatar  avatar  avatar  avatar  avatar  avatar  avatar  avatar  avatar  avatar  avatar  avatar  avatar  avatar  avatar  avatar  avatar  avatar  avatar  avatar  avatar  avatar  avatar  avatar  avatar  avatar  avatar  avatar  avatar  avatar  avatar  avatar  avatar  avatar  avatar  avatar  avatar  avatar  avatar  avatar  avatar  avatar  avatar  avatar  avatar  avatar  avatar  avatar  avatar  avatar  avatar  avatar  avatar  avatar  avatar  avatar

Watchers

 avatar  avatar  avatar  avatar  avatar  avatar  avatar  avatar  avatar  avatar  avatar  avatar  avatar  avatar  avatar  avatar  avatar  avatar  avatar  avatar  avatar  avatar  avatar  avatar  avatar  avatar  avatar  avatar  avatar  avatar  avatar  avatar  avatar  avatar  avatar  avatar  avatar  avatar  avatar  avatar  avatar  avatar  avatar  avatar  avatar  avatar

neovis.js's Issues

Events

When a node is clicked (aka selected), it would be great for an application to be able to (a) interact with that node's data and (b) fire a script.

For example, here I have a jquery panel that slides in the from the right to show the details associated with a node. An ajax neomodel query is made using the node's uid. Right now I just have this hooked up to a custom link that has an attribute node-uid="147" for a demo, but I'd like to be able to click on a node in order to access it's ID and fire a script.

I suppose better popover functionality would help, but I'd really like the freedom to interact with the data just like I've made a db query. When you click on a node in this vivagraphjs example it pulls up a whole new set of DOM data.

how neovis.js connect to the remote server.

hi, I used neovis.js to show my neo4j databse. when I put the database on local computer, it's work well. but when I put the database to the remote server. It can't work. the server is works good, I used the code below to connect to it. but I config the neovis.js, it's not work. can you help me, Is there other config I wanted to do? thank you very much.
var bolturl = "bolt://210.XX.57.XX:7687";
var username = "neo4j";
var password = "psw";
var authToken = neo4j.v1.auth.basic(username, password);
console.log(authToken);
driver = neo4j.v1.driver(bolturl, authToken, {encrypted:false});
session = driver.session();
return session.run(statement, parameters)

Sample data to replicate graph as per README

@johnymontana
This looks like a project with great potential. I expect you haven't had time to focus on this but was wondering if you might be able to add a gist that would allow us to load some data to an empty neo4j and reproduce the graph as per the readme. Thanks.

Hi, may you do some optimization on the arraws?

It was only a suggestion.
When we zoomed in the pics, the thickened thread is incompatible with the arrow attached to.
May you do some optimization on the representations? Or may I config it?

ERROR in /home/../../assets/neovis.js (121,2): Unreachable code detected

Hi ,

I have angular app . It was running and not giving any error until i started getting error -

ERROR in /home/dell/Downloads/Neo4j/Project/Neo4j-4/neo4jproject/src/assets/neovis.js (121,2): Unreachable code detected.
ERROR in /home/dell/Downloads/Neo4j/Project/Neo4j-4/neo4jproject/src/assets/neovis.js (14109,3): Unreachable code detected.
ERROR in /home/dell/Downloads/Neo4j/Project/Neo4j-4/neo4jproject/src/assets/neovis.js (15232,3): Unreachable code detected.
ERROR in /home/dell/Downloads/Neo4j/Project/Neo4j-4/neo4jproject/src/assets/neovis.js (19591,7): Unreachable code detected.
ERROR in /home/dell/Downloads/Neo4j/Project/Neo4j-4/neo4jproject/src/assets/neovis.js (19615,7): Unreachable code detected.
ERROR in /home/dell/Downloads/Neo4j/Project/Neo4j-4/neo4jproject/src/assets/neovis.js (214,131): Unreachable code detected.

It is the same Neovis.js file.

Please help.

Is it because my pc is slow? It is very slow.

Different Relationships in Different Colors

It would be good, if we can specify the color property for each relationship in draw() method, just like how we can define color for each relationship in Neo4j Desktop browser version.

relationships: {
"T3_Inquired_On_T4": {
"caption": "T3_Inquired_On_T4",
"color": "Green" //we can't specify colors to relationship now
},
"T4_Inquired_On_T5": {
"caption": "T4_Inquired_On_T5",
"color": "Blue" //we can't specify colors to relationship now
},

Same color for same Relationship nodes/same Origination nodes

Hi,

We have a concern. As showed in the example diagram , all the same originated nodes or probably same relationship nodes here have same color

api_mining_samecolor

but in my neovis.js we get a different output of colors of the nodes belonging to the same relationship/ origination from the same node-

api_mining_neovis_different_color

Can this issue of different colors be resolved and that the color of the node be made the same as its relationship parameter.

Is there a npm package for this?

I can't find a npm package for this. I wanted to use this library in a react application. I tried various methods to use the script tag, nothing seemed to work.

Unable to implement Neovis in angular app

Reference - #32

I am getting error -

    Property 'NeoVis' does not exist on type 'Window' 

on entering it like this in my index.html file of my angular2 app

  <script src="https://cdn.rawgit.com/neo4j-contrib/neovis.js/master/dist/neovis.js"></script>
  <script>window.Neovis = Neovis</script>

code in angular api app -

     var viz = new window.NeoVis.default(config);  

full code of app.component.ts

   export class Neo4jPrimaryComponent implements OnInit {

      constructor(private http: Http,  private notify: ToasterService) { }

      emptyObj1;
      emptyObj;
       info;
      neo4jframe;
       viz;

      ngOnInit() {
       this.viewNodesStart();


        const url = 'bolt://localhost:11003';
        const username = 'neo4j';
        const password = 'Virt';
        const encrypted = true;


       var config = {
           container_id: "viz",
            server_url: "bolt://localhost:11001",
            server_user: "neo4j",
            server_password: "Virtuallib1",
              labels: {
               //"Character": "name",
          "API": {
                "caption": "name",
                "size": "pagerank",
                "community": "community"
      
                  }
               },
           relationships: {
             "cc": {
             "thickness": "weight",
             "caption": false
               }
           },
   
  
          initial_cypher :"MATCH (n) RETURN (n)"  ,                 
           arrows: true
          };                 
     this.viz = new window.NeoVis.default(config);  

       this.viz.render();
        console.log(this.viz);
     }


               viewNodesStart() {

                 console.log("INSIDE viewNodesStart()")

            // Nodes Value

              console.log("inside Nodes Value");
                var data = localStorage.getItem('token');

           console.log("data is=>",data+ "emptyobj1 = "+ this.emptyObj1);

             var url = config.url;
              var port = config.port;

               var object = {
              "emptyObj" : this.emptyObj
              }

             this.http.post("http://" + url+":" + port + "/viewNodesStart",this.emptyObj1)
               .map(Response => Response)
               .subscribe((res: Response) => {

            console.log("XXXXXXXXXXXX Response on /viewNodesStart", res);

               this.info = res;
              if (this.info.statusCode == 200) {
              console.log("Data added successfully");
   
                 } else {
               console.log("Data is not inserted")
   
                  }
 
                  });
 
                    }

                  }

Installing Neovis.js on Typescript project

I tried to install neovis.js on a Ionic2/Typescript project so I tried the following:

Solution: Adding the library in the CDN version and declaring it into the project:
declare let NeoVis: any; will work.
Is there any way to fetch the database from backend and just add the results to NeoVis? I am asking this because the bolt conector seems to be deprecated while using cloud databases and I am unable to connect (and the HTTPS:// is not recognized):

WebSocket connection failure. Due to security constraints

Other failures trying to add the library into Typescript app:
1. First to add a lib folder with neovis already added and to just import neovis.js from src. Although, this way to use the library is not working due to the vendor libraries which are not installed and by typing npm install on the library will not install also those submodules.

2. I also tried to install it with npm:
npm install https://github.com/johnymontana/neovis.js.git --save

But I am getting:

Failed to clone 'vendor/neo4j-javascript-driver'. Retry scheduled

Is there any way to use NeoVis with Typescript?

3: Even if I try to clone the project I am unable to fetch the vendor files by using:
git clone REPO --recursive

4: I installed in the main project both vendor libraries, and changed the references to them and also changed from .js to .ts the src files.
I am getting now

hammer.assign is not a function error
This seems to be an error found also on VIS library.

Neovis events

Since it is not possible to attach events to a vis.js structure before it is rendered, it would be extremely useful if Neo4vis,js could fire a 'vizCompleted' type of event when the render() function is completed.

That would help with adding click() events on the vis.js structure itself or trigger additional customizations on top of the options Neovis.js provides (and it would keep you from having to wrap every single option from vis.js inside Neovi.js).

Viz.Stabilize / Freeze upon User preferred/dragged location of Node/Arrow

Can we please have both the nodes and relationship stabilize or frozen upon user dragged / preferred location in the screen, rather than all of them coming back to the original state...

We know this is in Lincurious, but would be a great value add to have it as property, so user can set Freeze or Stabilize = True

Neo4j/neovis use case help.

I have a use case where I am creating a web based graphical web crawler where a user can input a starting URL, define a breadth vs depth crawl, and set a limit to the number of URLs the crawler will hit. I want to return the results via neovis graph. What is the best practice for this use case. I could create a neo4j graph for each user crawl, then match query the results and return the visualization via neovis, then delete the graph entry, but that doesn't seem very efficient. What would be the best way in this case?

Error - Cannot read property 'constructor' of null while using Neovis.js

Information:

neo4j version - 3.4.7 Enterprise,
browser version - Version 3.4.7
what kind of API / driver do you use - I am using Neovis.js
With cypher query -
var cypherQuery =

  "MATCH (n) OPTIONAL MATCH (n)-[r]->(m) RETURN n,r,m LIMIT 10";

I get proper response -

neovis-1

Issue is - I get an error message

  ERROR TypeError: Cannot read property 'constructor' of null

when my Limit in the cypher query increases beyond 10.

(say )- var cypherQuery =

     "MATCH (n) OPTIONAL MATCH (n)-[r]->(m) RETURN n,r,m LIMIT 15";

complete log of error -

ERROR TypeError: Cannot read property 'constructor' of null
at neovis.js:36514
at Record.forEach (neovis.js:33630)
at Object.onNext (neovis.js:36511)
at _RunObserver.onNext (neovis.js:33014)
at Connection._handleMessage (neovis.js:31442)
at Dechunker.Connection._dechunker.onmessage (neovis.js:31392)
at Dechunker._onHeader (neovis.js:30537)
at Dechunker.AWAITING_CHUNK (neovis.js:30490)
at Dechunker.write (neovis.js:30548)
at WebSocketChannel.self._ch.onmessage (neovis.js:31365)

Please help.

Source code -

  const url = 'bolt://localhost:11001';
  const username = 'neo4j';
  const password = 'Vab1';
  const encrypted = true;

MATCH (n) OPTIONAL MATCH (n)-[r]->(m) RETURN n,r,m LIMIT 30

    var cypherQuery = "";

     var config = {
     container_id: "viz",
     server_url: "bolt://localhost:11001",
     server_user: "neo4j",
     server_password: "Vr123",
     labels: {
    
        "Banking": {
            "caption": "name",
            "size": "pagerank",
            "community": "community"
           
             }
          },
         relationships: {
          "cc": {
            "thickness": "weight",
            "caption": false
            }
       },
   RETURN cc",

        initial_cypher: cypherQuery ,        
        arrows: true,
        hierarchical_layout:true,
         hierarchical_sort_method:"directed",
   
        };                 
       this.viz = new NeoVis.default(config);  

       this.viz.render();
       console.log(this.viz);
        }

Does not connect

UPDATES below ...


neovis.js does not connect with my localhost, username | password (obfuscated here):

server_url: "bolt://localhost:7474",
server_user: ***,
server_password: ***,

Also tried adding

encrypted: "ENCRYPTION_ON";

(#11) to ... var config = {...}...

Are there neo4j.conf settings that also need to be configured?

Neovis.js installed per README, including NPM modules.

Neo4j 3.3.4 instance running with edited (per above) "trolltweets.html" file. Data loaded, displaying, querying fine in Neo4j Browser.


UPDATE 1/2:

server_url: "bolt://localhost:7687",
server_user: ***,
server_password: ***,

Note updated BOLT address. The loaded webpage,

file:///...trolltweets.html

remains BLANK (using the default HTML code provided - probably a misplaced or missing comma, somewhere), until you manually enter a Cypher query, e.g.

MATCH (n:Character) RETURN n LIMIT 25

UPDATE 2/2:

I did a crude neovis.js implementation of my metabolic pathway shown in the Neo4j Browser at the bottom of my SO post, https://stackoverflow.com/questions/49682338/creating-a-metabolic-pathway-in-neo4j/49805022#49805022

Here is the rendering, in neovis.js

neovis js simple example - mozilla firefox_139

with this code snippet

        labels: {
          "Metabolism": {
            "caption": "name"
          }
          },
          relationships: {
            "substrate_of": {
              "caption": true
              },
            "yields": {
              "caption": true
              }
          },
          initial_cypher: "MATCH p=()-->() RETURN p"

that auto-loads that Cypher query.

My Neo4j / Cypher labels are :Metabolism:Gycolysis and :Metabolism:TCA.

In neovis.js, I could only display the names for the metabolite nodes using the "Metabolism" label (following that simple HTML sample code, at least).

Sending Cypher

Not sure if I missed it already in there or if this could be a feature request, but it would be nice to be able to pull a subgraph using cypher. I have a multi-tenant application and would love to show them the connections for their account instead of the complete graph.

Key Word

Hi,

I was wondering if it is possible to search via "keyword" not "cypher" in the web application.

Best...

Erdal Ayan

How to make a uniform color for a set of nodes in neovis.js / vis.js

I am working with Neo4j application. And it creates nodal graph. To display the nodal graph on UI , we have Neovis.js. Neovis.js name taken from vis.js. The output that i get is -

organisationdashboard

Here in the picture, all the nodes have a different color. We have relationships like Department, Function, System, Parameter,etc. I want a uniform color for all the nodes with relationship - Parameter and all the nodes with relationship - Department, etc. As in this pic -

uniform-dash

Please suggest changes in the following codes. It will be very useful.

code -

visjs in Neovis.js

visjs: {
        interaction: {
            hover: true,
            hoverConnectedEdges: true,
            selectConnectedEdges: false,
  
            multiselect: 'alwaysOn',
            zoomView: false,
            experimental: { }
        },
        physics: {
            barnesHut: {
                damping: 0.1
            }
        },
        nodes: {
            mass: 4,
            shape: 'neo',
            labelHighlightBold: false,
            widthConstraint: {
                maximum: 40
            },
            heightConstraint: {
                maximum: 40
            }
        },
        edges: {
            hoverWidth: 0,
            selectionWidth: 0,
            smooth: {
                type: 'continuous',
                roundness: 0.15
            },
            font: {
                size: 9,
                strokeWidth: 0,
                align: 'top'
            },
            color: {
                inherit: false
            },
            arrows: {
                to: {
                    enabled: true,
                    type: 'arrow',
                    scaleFactor: 0.5
                }
            }
        }

    }

front-end Neovis.js to display nodes

      var config = {
         container_id: "viz",
         server_url: "bolt://localhost:7474/",
         server_user: "neo4j",
         server_password: "ib1",
        labels: {
             //"Character": "name",
             "Banking": {
                 "caption": "name",
                 "size": "pagerank",
                 community: "community",
              
                 "sizeCypher": "MATCH (n) WHERE id(n) = {id} MATCH (n)-[r]-() RETURN sum(r.weight) AS c"
             },
             "Parameter": {
                "thickness": "weight",
                "caption": true,
                community: "community",
                "sizeCypher": "MATCH (n) WHERE id(n) = {id} MATCH (n)-[r]-() RETURN sum(r.weight) AS c"
            },
            "Method": {
               "thickness": "weight",
               "caption": true,
               community: "community",
               "sizeCypher": "MATCH (n) WHERE id(n) = {id} MATCH (n)-[r]-() RETURN sum(r.weight) AS c"
           },
           "Request": {
               "thickness": "weight",
               "caption": true,
               community: "community",
           },
           "Response": {
               "thickness": "weight",
               "caption": true,
               "community": "Pink"
           },
           "Paths": {
               "thickness": "weight",
               "caption": true,
               "community": "Purple"
           },
           "API": {
               "thickness": "weight",
               "caption": true,
               "community": "Black"
           },
           "Department": {
               "thickness": "weight",
               "caption": true,
               community: "community",
               "sizeCypher": "MATCH (n) WHERE id(n) = {id} MATCH (n)-[r]-() RETURN sum(r.weight) AS c"
           },
           "System": {
               "thickness": "weight",
               "caption": true,
               "community": "Red"
           },
             
         },
         relationships: {
             "Parameter": {
                 thickness: "weight",
                 caption: true,
                 community: "community",
                 color:'red'
             },
             "Method": {
                "thickness": "weight",
                "caption": true,
                "community": "Blue",
                'color':'red'
            },
            "Request": {
                "thickness": "weight",
                "caption": true,
                "community": "Red",
                'color':'green'
            },
            "Response": {
                "thickness": "weight",
                "caption": true,
                "community": "Red",
                'color':'black'
            },
            "Paths": {
                "thickness": "weight",
                "caption": true,
                "community": "Red",
                'color':'pink'
            },
            "API": {
                "thickness": "weight",
                "caption": true,
                "community": "Red",
                'color':'pink'
            },
            "Department": {
                "thickness": "weight",
                "caption": true,
                "community": "Red",
                'color':'pink'
            },
            "System": {
                "thickness": "weight",
                "caption": true,
                "community": "Red",
                'color':'pink'
            },
         },
       
         initial_cypher:cypherQuery ,        
        arrows: true,
        hierarchical_layout:true,
        hierarchical_sort_method:"directed",
        
     };         

Relationship color

What does it mean by the relationship color? For example: Node A is colored red, Node B is colored blue. Why sometimes I can find the relationship color is red, but sometimes it is blue?

Double click event

when click on node than node should be expand..
for example when we click on node A all is relations should be appended in same canvas.

Feature Request: Specify Node Color by its Property

Hi,

While currently it is auto coloring based on community attribute,
it would be good if we can specify the color by a node property
i.e., all the nodes with property status='Active' should color green and others red.

uma

Using a Non-GoT (different schema) database

Howdy,

What do I need to change in order to use a different database with different schema? It seems I can only get the visualization with the Game of Thrones data.

I've tried editing var viz: function draw labels and initial_cypher based on my database. And of course I've change the server_password, but there must be other items I need to address.

Can you please help?

Many Thanks,

Keith

Expose all vis.js config settings for override

Originally neovis.js was designed to hide the complexity of configuring the styling and physics of the visualization. However, it has become apparent that many users would like the flexibility to override the underlying vis.js configuration for styling and physics. Therefore we should expose all vis.js config options as optional overrides, rather than manually mapping and exposing a few config options.

cypher query to reproduce the graph

Hi,

Thanks for the detailed post on using neovis.js!

Could you please specify which cypher query was used to reproduced the Game of Thrones graph?

The default is

initial_cypher: "MATCH (n)-[r:INTERACTS]->(m) RETURN n,r,m"

I tried entering:
MATCH (c:Character)
WITH c ORDER BY size( (c)-[:INTERACTS]-() ) DESC LIMIT 50
WITH collect(c) as characters
RETURN [c IN characters | [ (c)-[r:INTERACTS]-(o) WHERE o IN characters AND r.weight > 30 | [c,r,o]]] as graph

But it did not work.

Hierarchical layout

Setting this config option to true does not change the layout view of my graph data.

Customization of the hoverNode behavior

Our graph has many properties on nodes, which makes the pop up details on Hover unusable as the popup takes over the whole screen.

Is there a way to disable it? or to send the content of the popup window to a different HTML container on the page?

label and relationship config not working.

Good evening,
I am trying to integrate neovis into my web application but I am having some issues in creating the test application that uses the Russian trolls db. Basically I am preparing my config object but, it is not getting the label and relationship properties from my object.
I tried putting a breakpoint in the buildNodeVisObject(n) function but when I load my graph the passed n.labels[0] is never the label of the node I want it to edit the properties of...
Am I doing something wrong?

Thanks,
Gustavo.

Feature request: export/import graph

Is it possible to add export/import graph functionality?

Following some examples from vis.js like:

http://visjs.org/examples/network/other/saveAndLoad.html
http://visjs.org/examples/network/data/importingFromGephi.html

This functionality could add some advantages, specially for those users that can't get access to the Neo4j server, or in case the user needs to work "local", or has limited internet connection, or in case it is needed to save specific state of the graph or query result for future comparisons.

Two different graphs from different sources. (In this case is the same graph)

image

Most of the users don't have the training to create the cypher to answer the questions, but some of them are asking for information all the time.

This just simply could facilitate the process transferring the data to upload to one or several users.

Can't Connect to Graphenedb instance of Neo4j

Can't connect to Neo4j Graphene connection using:

var viz;
function draw() {
var config = {
container_id: "viz",
server_url: "bolt://....dbs.graphenedb.com:12345",
server_user: "neo4j",
server_password: "12345",

Here's the dev console report:

WebSocket connection to 'ws://....dbs.graphenedb.com:12345/' failed: Connection closed before receiving a handshake response

NeoVis_config: {container_id: "viz", server_url: "bolt://.....dbs.graphenedb.com:12345", server_user: "user", server_password: "12345", labels: {…}, …}_container: div#viz_data: {nodes: n, edges: n}_driver: Driver {_url: "....dbs.graphenedb.com:12345", _userAgent: "neo4j-javascript/0.0.0-dev", _openSessions: {…}, _sessionIdGenerator: 1, _token: {…}, …}_edges: n {_options: {…}, _data: {…}, length: 0, _fieldId: "id", _type: {…}, …}_network: null_nodes: n {_options: {…}, _data: {…}, length: 0, _fieldId: "id", _type: {…}, …}_query: "MATCH (n)-[r:BREWS]->(m) RETURN n,r,m Limit 5"proto: Object
neovis.js:12345 WebSocket connection to 'ws://....dbs.graphenedb.com:12345/' failed: Connection closed before receiving a handshake response

WebSocketChannel @ neovis.js:12345
neovis.js:12345 Error: WebSocket connection failure. Due to security constraints in your web browser, the reason for the failure is not available to this Neo4j Driver. Please use your browsers development console to determine the root cause of the failure. Common reasons include the database being unavailable, using the wrong connection URL or temporary network problems. If you have enabled encryption, ensure your browser is configured to trust the certificate Neo4j is configured to use. WebSocket readyState is: 3
at new Neo4jError (neovis.js:12345)
at newError (neovis.js:12345)
at WebSocketChannel._handleConnectionError (neovis.js:12345)

Turning off console logging

Is there a way to turn off the logging that happens automatically in the console when using this package?

Different Nodes in Different Colors

Can we have the Color attribute in the Node level?

Currently, per William Lyon, we have this as Community property of node, but that will work only for Integer datatype field. Would be good to define Color property too, along with Clustering Community colors on String/Integer field values.

Please advise the new syntax in JS upon this implementation.

Thanks,
Jay

Feature Request : Get to know about the details of execution

Hi,
The existing features are really good and promising. It would be great if we had an option for knowing the execution time of a query, load time of a graph and other such parameters to compare which will help us analyse better in js module itself.

Relationship caption by label or labels[] in case of multivalue

Hello,
The really one issue its that most people want to add some tags in the relationship between nodes. Is that possible with neovis.js to appears over the relationship line a name from label or label if we are talking for multi-labeled relationship?
Thanks,

Recommend Projects

  • React photo React

    A declarative, efficient, and flexible JavaScript library for building user interfaces.

  • Vue.js photo Vue.js

    🖖 Vue.js is a progressive, incrementally-adoptable JavaScript framework for building UI on the web.

  • Typescript photo Typescript

    TypeScript is a superset of JavaScript that compiles to clean JavaScript output.

  • TensorFlow photo TensorFlow

    An Open Source Machine Learning Framework for Everyone

  • Django photo Django

    The Web framework for perfectionists with deadlines.

  • D3 photo D3

    Bring data to life with SVG, Canvas and HTML. 📊📈🎉

Recommend Topics

  • javascript

    JavaScript (JS) is a lightweight interpreted programming language with first-class functions.

  • web

    Some thing interesting about web. New door for the world.

  • server

    A server is a program made to process requests and deliver data to clients.

  • Machine learning

    Machine learning is a way of modeling and interpreting data that allows a piece of software to respond intelligently.

  • Game

    Some thing interesting about game, make everyone happy.

Recommend Org

  • Facebook photo Facebook

    We are working to build community through open source technology. NB: members must have two-factor auth.

  • Microsoft photo Microsoft

    Open source projects and samples from Microsoft.

  • Google photo Google

    Google ❤️ Open Source for everyone.

  • D3 photo D3

    Data-Driven Documents codes.