Extending MLflow for Visualization Models
The mlflow-vizmod project allows data scientists to be more productive with their visualizations. We treat visualizations as models - just like ML models - thus being able to use the same infrastructure as MLflow to track, create projects, register, and deploy visualizations.
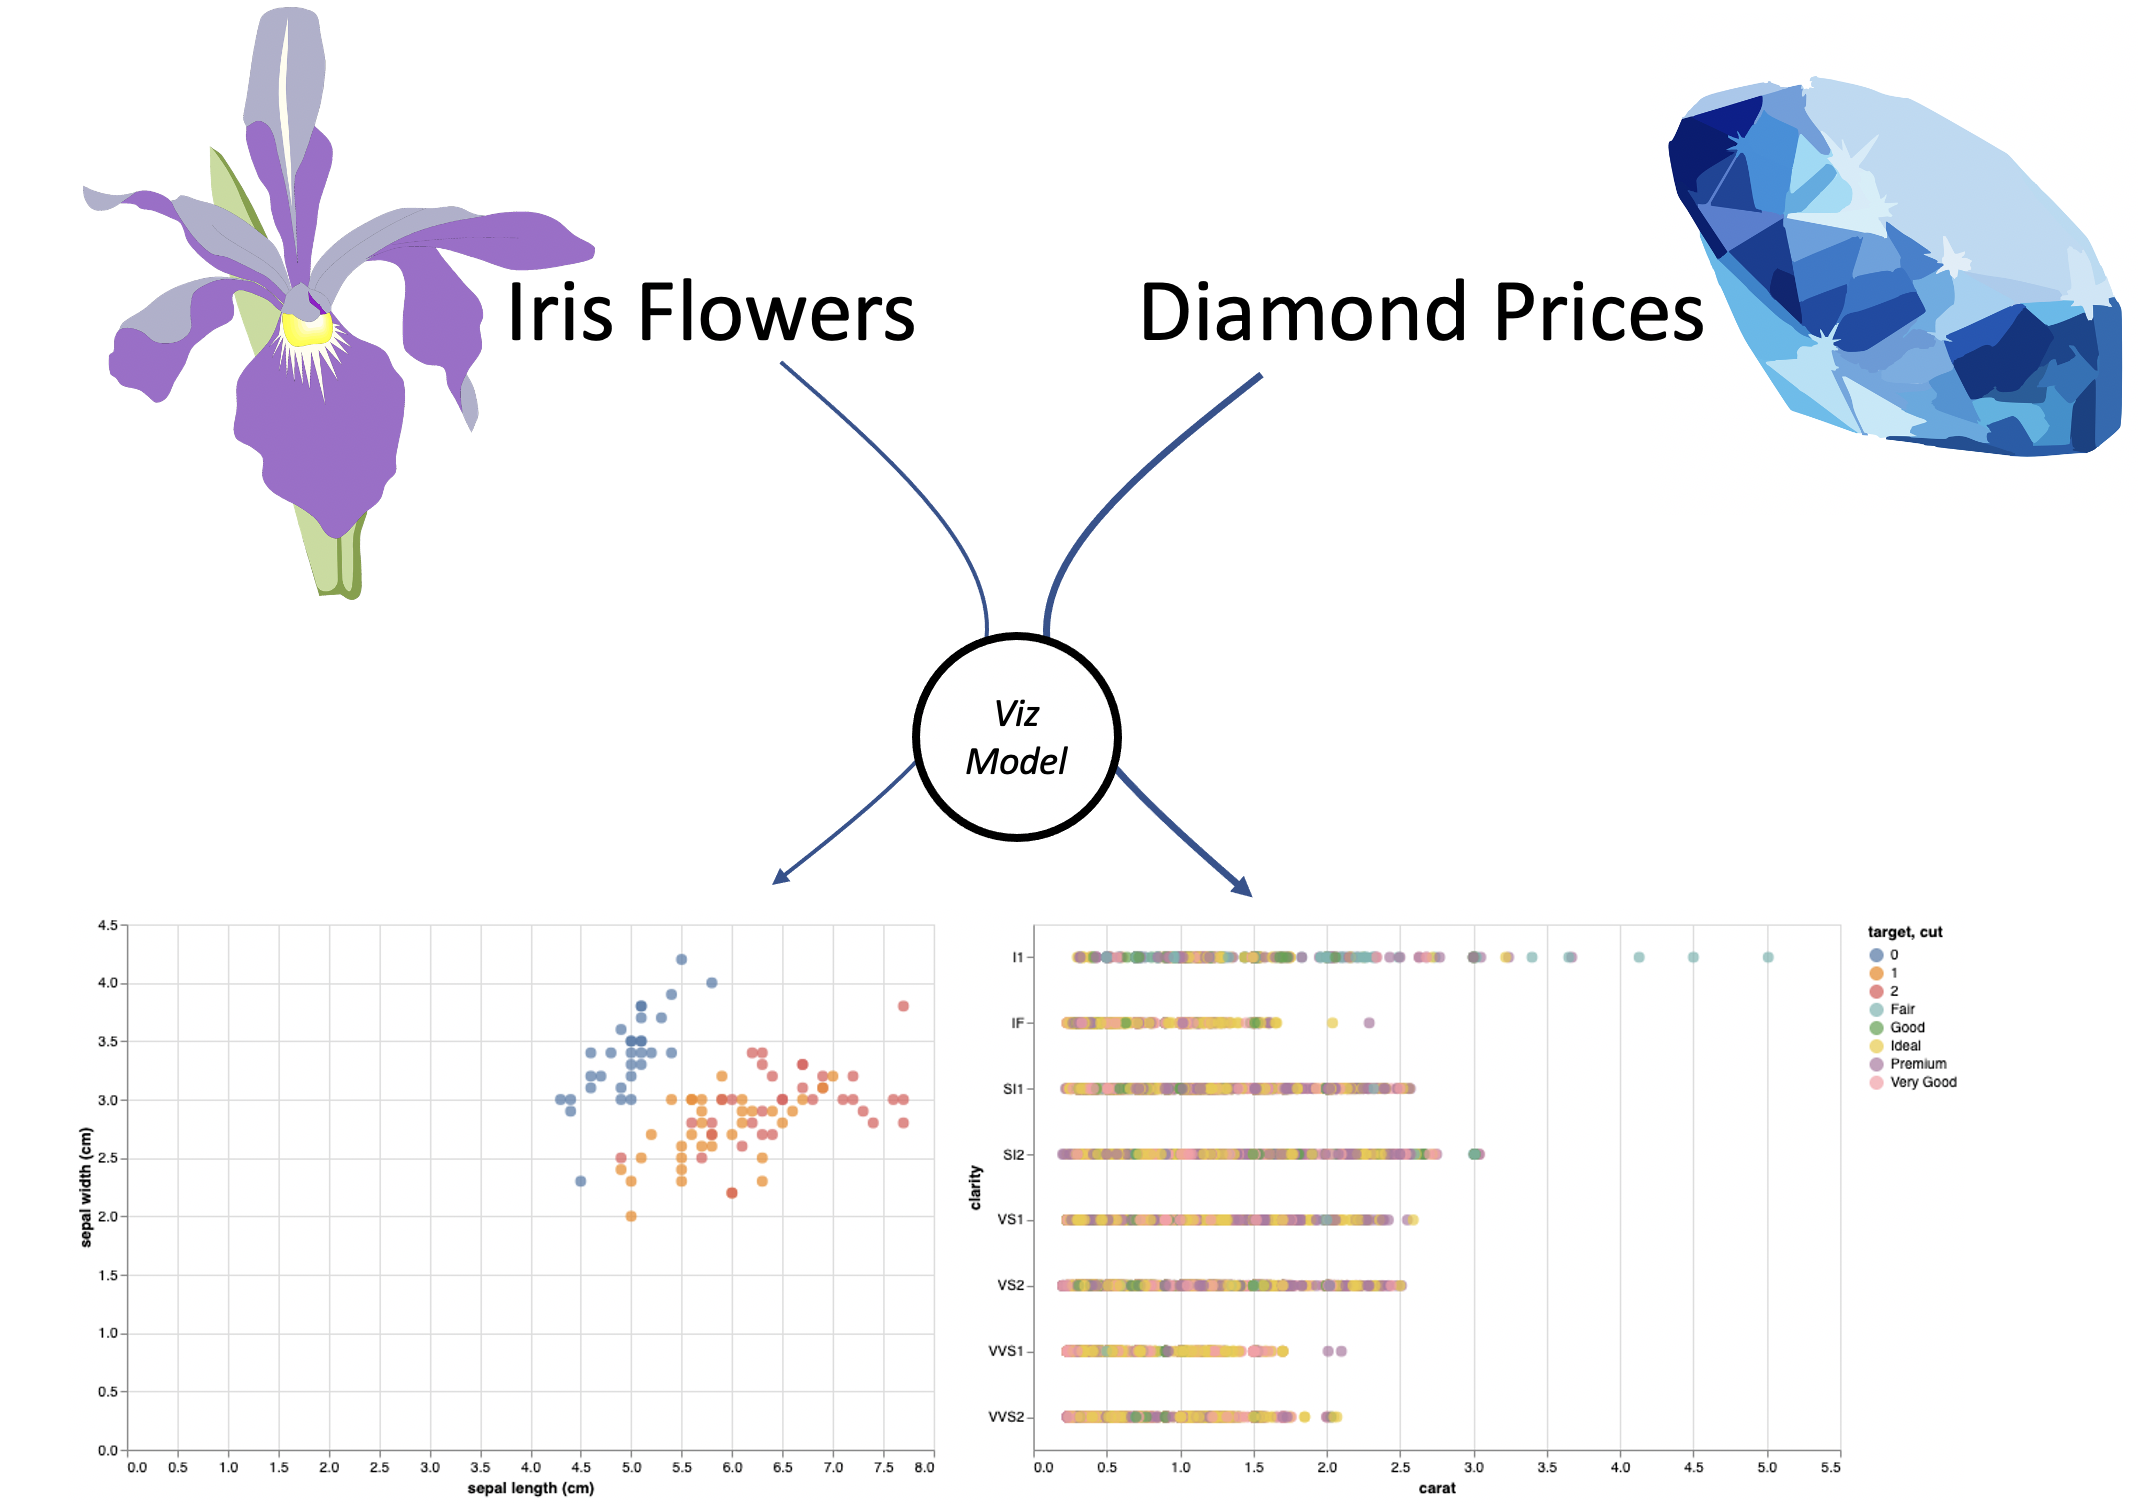
Use the same visualization model to generate and deploy two different visualizations based on different datasets.
We would love to have you try it out and give us feedback through GitHub Issues.
Try the mlflow-vizmod tutorial using a Jupyter notebook here.
Note, this is placeholder text until we make the project publicly available.
mlflow-vizmod can be installed using the Python wheel or via pip.
# pip
pip install mlflow-vizmodexport MLFLOW_TRACKING_URI='http://localhost:5000'
mlflow ui --backend-store-uri sqlite:///mlflow.dbThe concept of a model extends far beyond machine learning encompassing any approximation of a system or process we wish to understand. Machine learning models fit into a category of mathematically rigorous models that can be developed and used with the scientific method (hypothesis testing etc.) but are by no means the beginning or end of the model space continuum.
Visualizations can be used as models themselves or a means of visually communicating the results, quality etc. of machine learning or other models, to reduce cognitive load on the end user.
- Visualizations require code/concept development and design like any other model this process needs to be captured to be re-usable and reproduceable
- Re-usability and deployability can be enhanced by including the visualization code in a registry, ready to accept compliant data to visualize, much like a machine learning model can be serialized, and deployed, ready to accept new instances of data for inference
This pattern could very effective at orchestrating de-centralized data science workflows, typically found in academia, healthcare, and small startups. It allows developers to push and pull visualizations from a central registry (ie. MLflow deployed with Databricks or as part of a service stack on cloud VMs).
To generate a visualization model using mlflow-vizmod, use the viz model flavor API which conceptually follows the MLflow API. For example, the following code snippet is how you log a sklearn model.
# Define and Fit Model
clf = RandomForestClassifier(max_depth=7, random_state=RANDOM_STATE)
clf.fit(X_train, y_train)

# Log Accuracy
mlflow.log_metric('accuracy', value=clf.score(X_test, y_test))

# Log Model
mlflow.sklearn.log_model(
    sk_model=clf,
    artifact_path='model',
)
The following code snippet is how you log a vega lite visualization model.
# Define Viz
viz_iris = alt.Chart(
    df_iris
).mark_circle(size=60).encode(
    x='x',
    y='y',
    color='z:N',
).properties(
    height=375,
    width=575,
).interactive()

# Log Model
mlflow_vizmod.log_model(
    model=viz_iris,
    artifact_path='viz',
    style='vegalite',
    input_example=df_iris,
)

# Optional: log artifact
viz_iris.save('./example.html')
mlflow.log_artifact(local_path='./example.html', artifact_path='charts')
We will also replace the generic (x, y, z) labels with the dataset specific components.
# Label Chart
viz_iris.title = 'Iris Classifications'
viz_iris.encoding.x.title = column_map_iris['x']
viz_iris.encoding.y.title = column_map_iris['y']
viz_iris.encoding.color.title = column_map_iris['z']
viz_irisNow, that you have defined a model, you can load the saved model and apply it to a different dataset.
First we will load the ML model.
# Load model
model_uri = os.path.join(run_iris.to_dictionary()['info']['artifact_uri'], 'viz')
loaded_viz_iris = mlflow_vizmod.load_model(
    model_uri=model_uri,
    style='vegalite'
)
Next, we will load the visualization model; just like an ML model must be able to accept new instances of data for inference and that instance must be compliant with the model in terms of features, so must a visualization be able to accept and render new instances of compliant data
# Reuse Iris Viz
viz_diamond = loaded_viz_iris.display(df_diamond)


# Label Chart
# We're replacing the generic x,y,z labels with their dataset-specific counterparts
viz_diamond.title = 'Diamond Classifications'
viz_diamond.encoding.x.title = column_map_diamond['x']
viz_diamond.encoding.y.title = column_map_diamond['y']
viz_diamond.encoding.color.title = column_map_diamond['z']


# Rendering new data / subset of data
viz_iris | viz_diamond
With mlflow-vizmod you can create a new visualization using the same model (viz_iris) from the first visualization model (i.e. model_uri).
You can deploy an interactive web visualization using mlflow-vizmod. This use case is particuarly effective with Vegalite, since models are encoded as JSON objects, which accept pointers to data. This means you can store the JSON object as an artifact and use the visualization API to point it at new data.
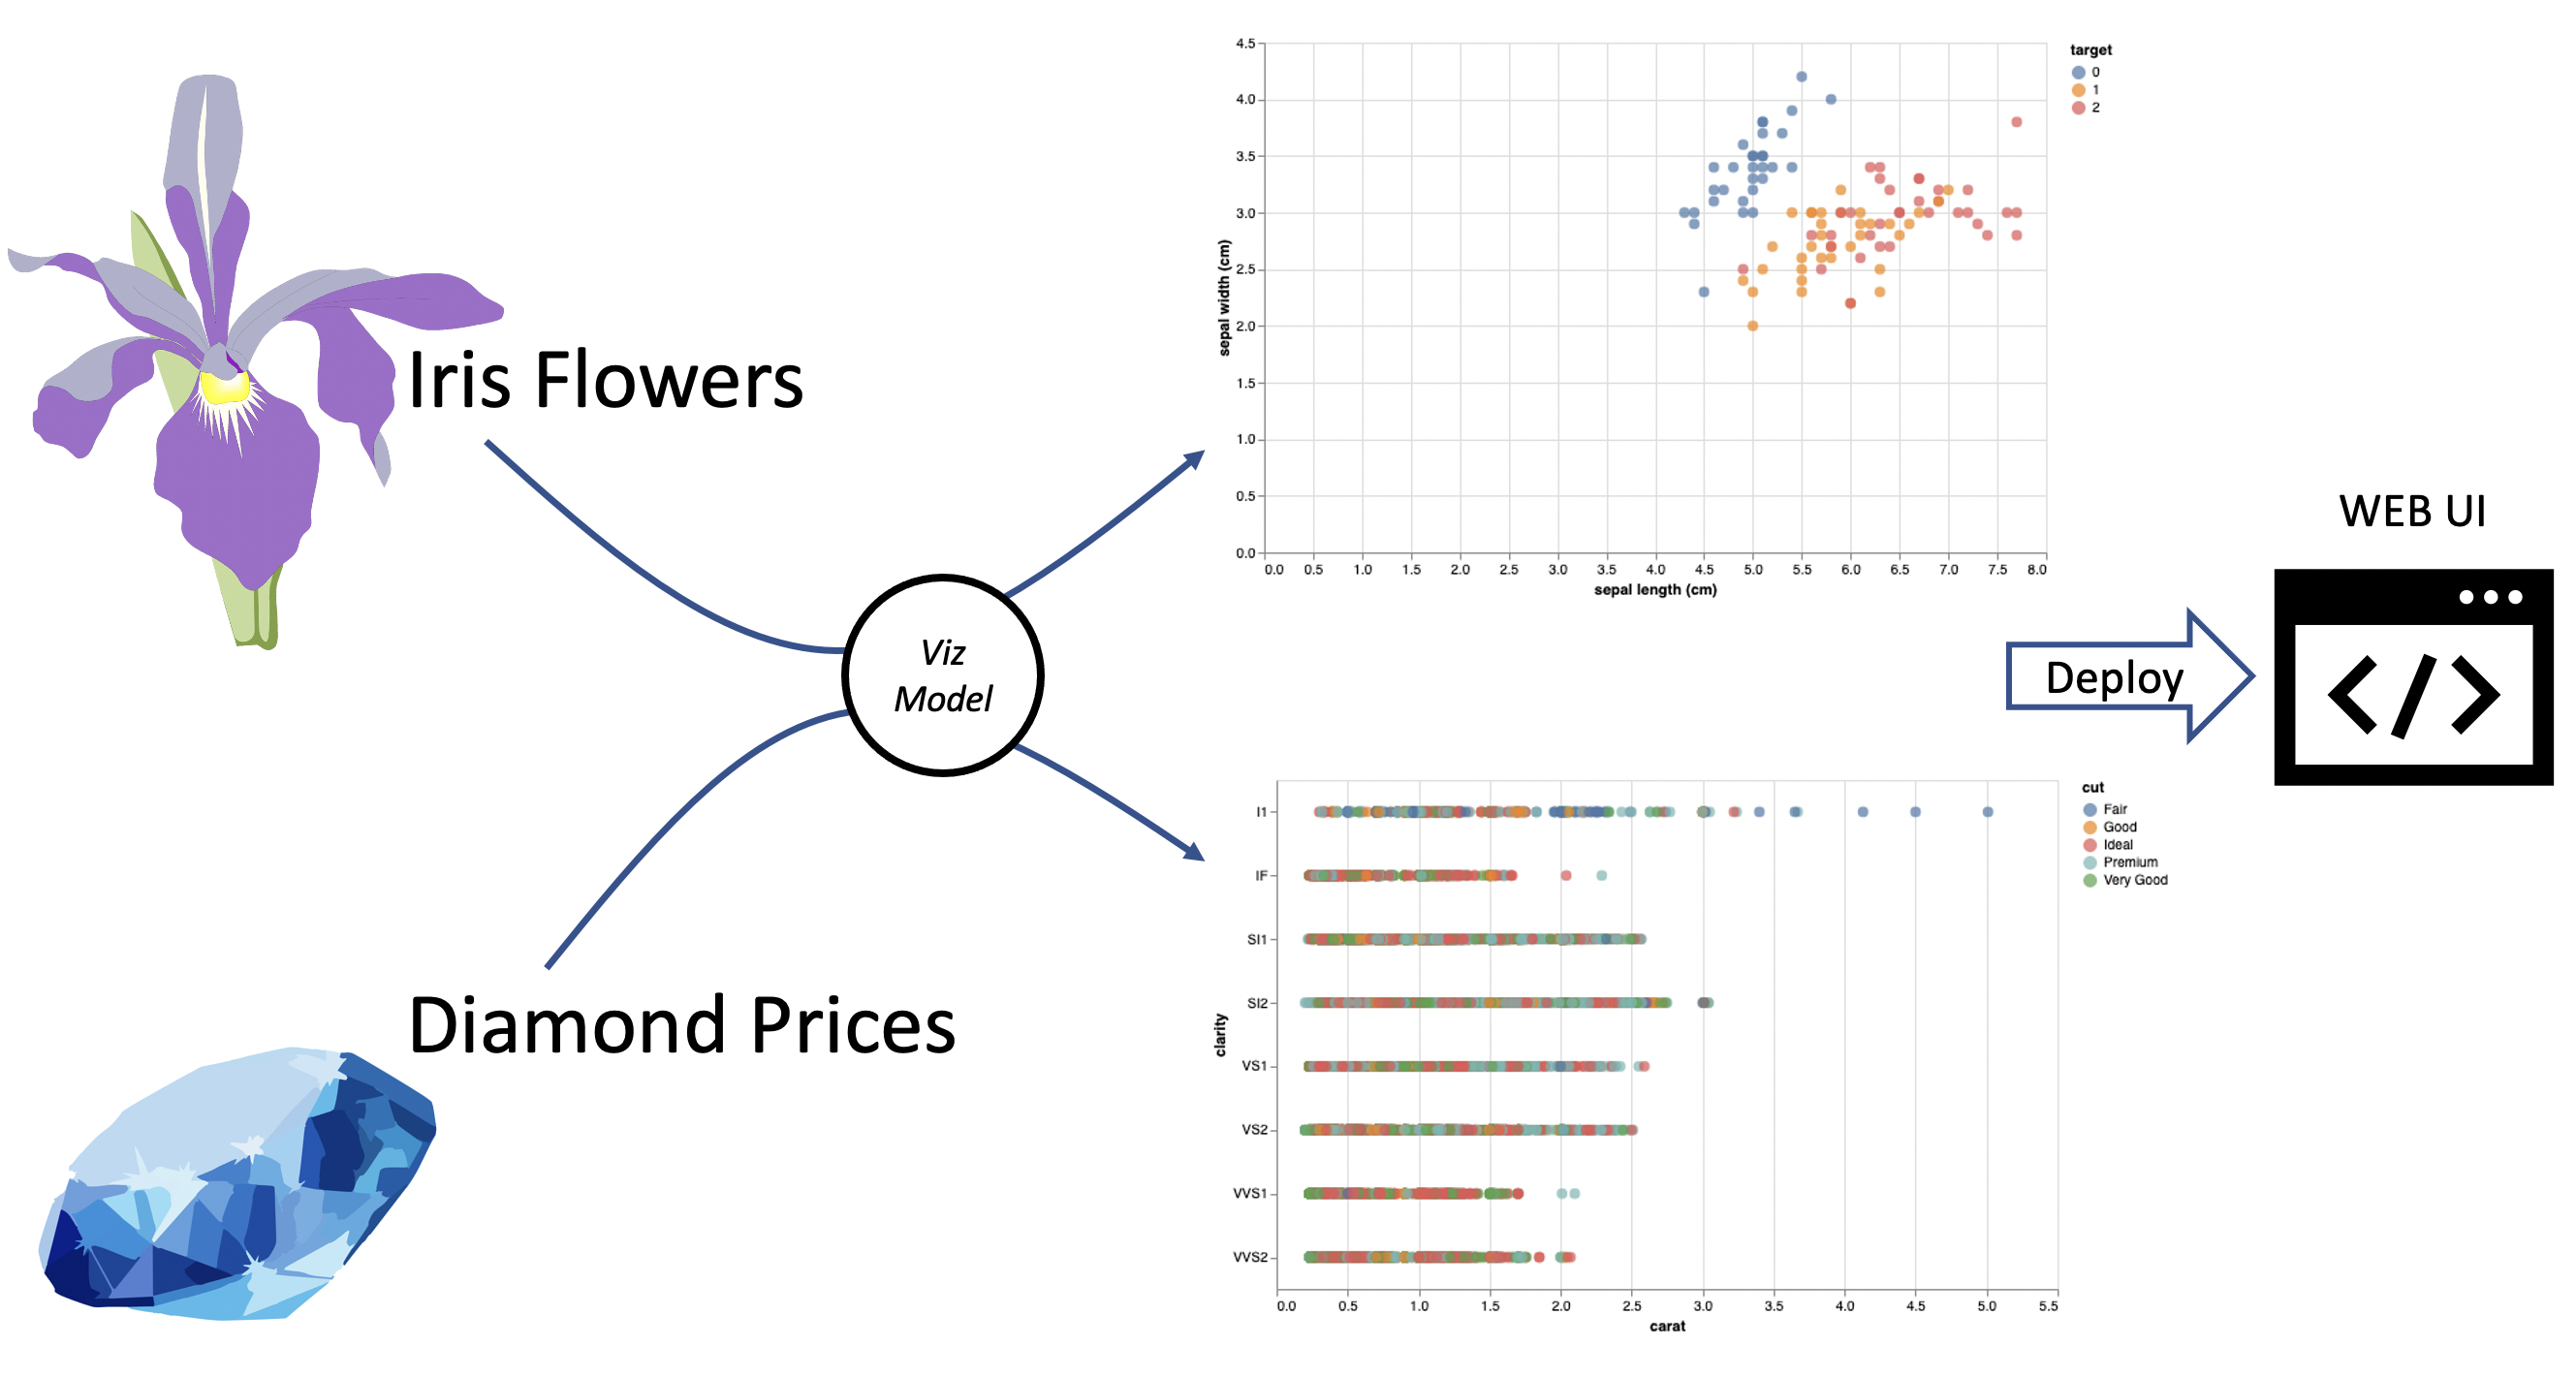
To do this:
- Encode a visualization (ie. a geo map for ICU bed utilization and covid cases for each county in the USA with size/color encodings and tooltips which help the end user make decisions on where patients or resources should be sent)
- Register the visualization
- Pull the visualization and point it at a compliant data set of interest
- Deploy to a website (the website would already have panel or some other mechanism of accpeting the registered visualization)
- Alter the visualization as needed, using registry tags to point the new version of the model