Git Product home page Git Product logo

Setting up Logging for cluster

Setting up logging for a Kubernetes Cluster using Rancher V2.5 logging .

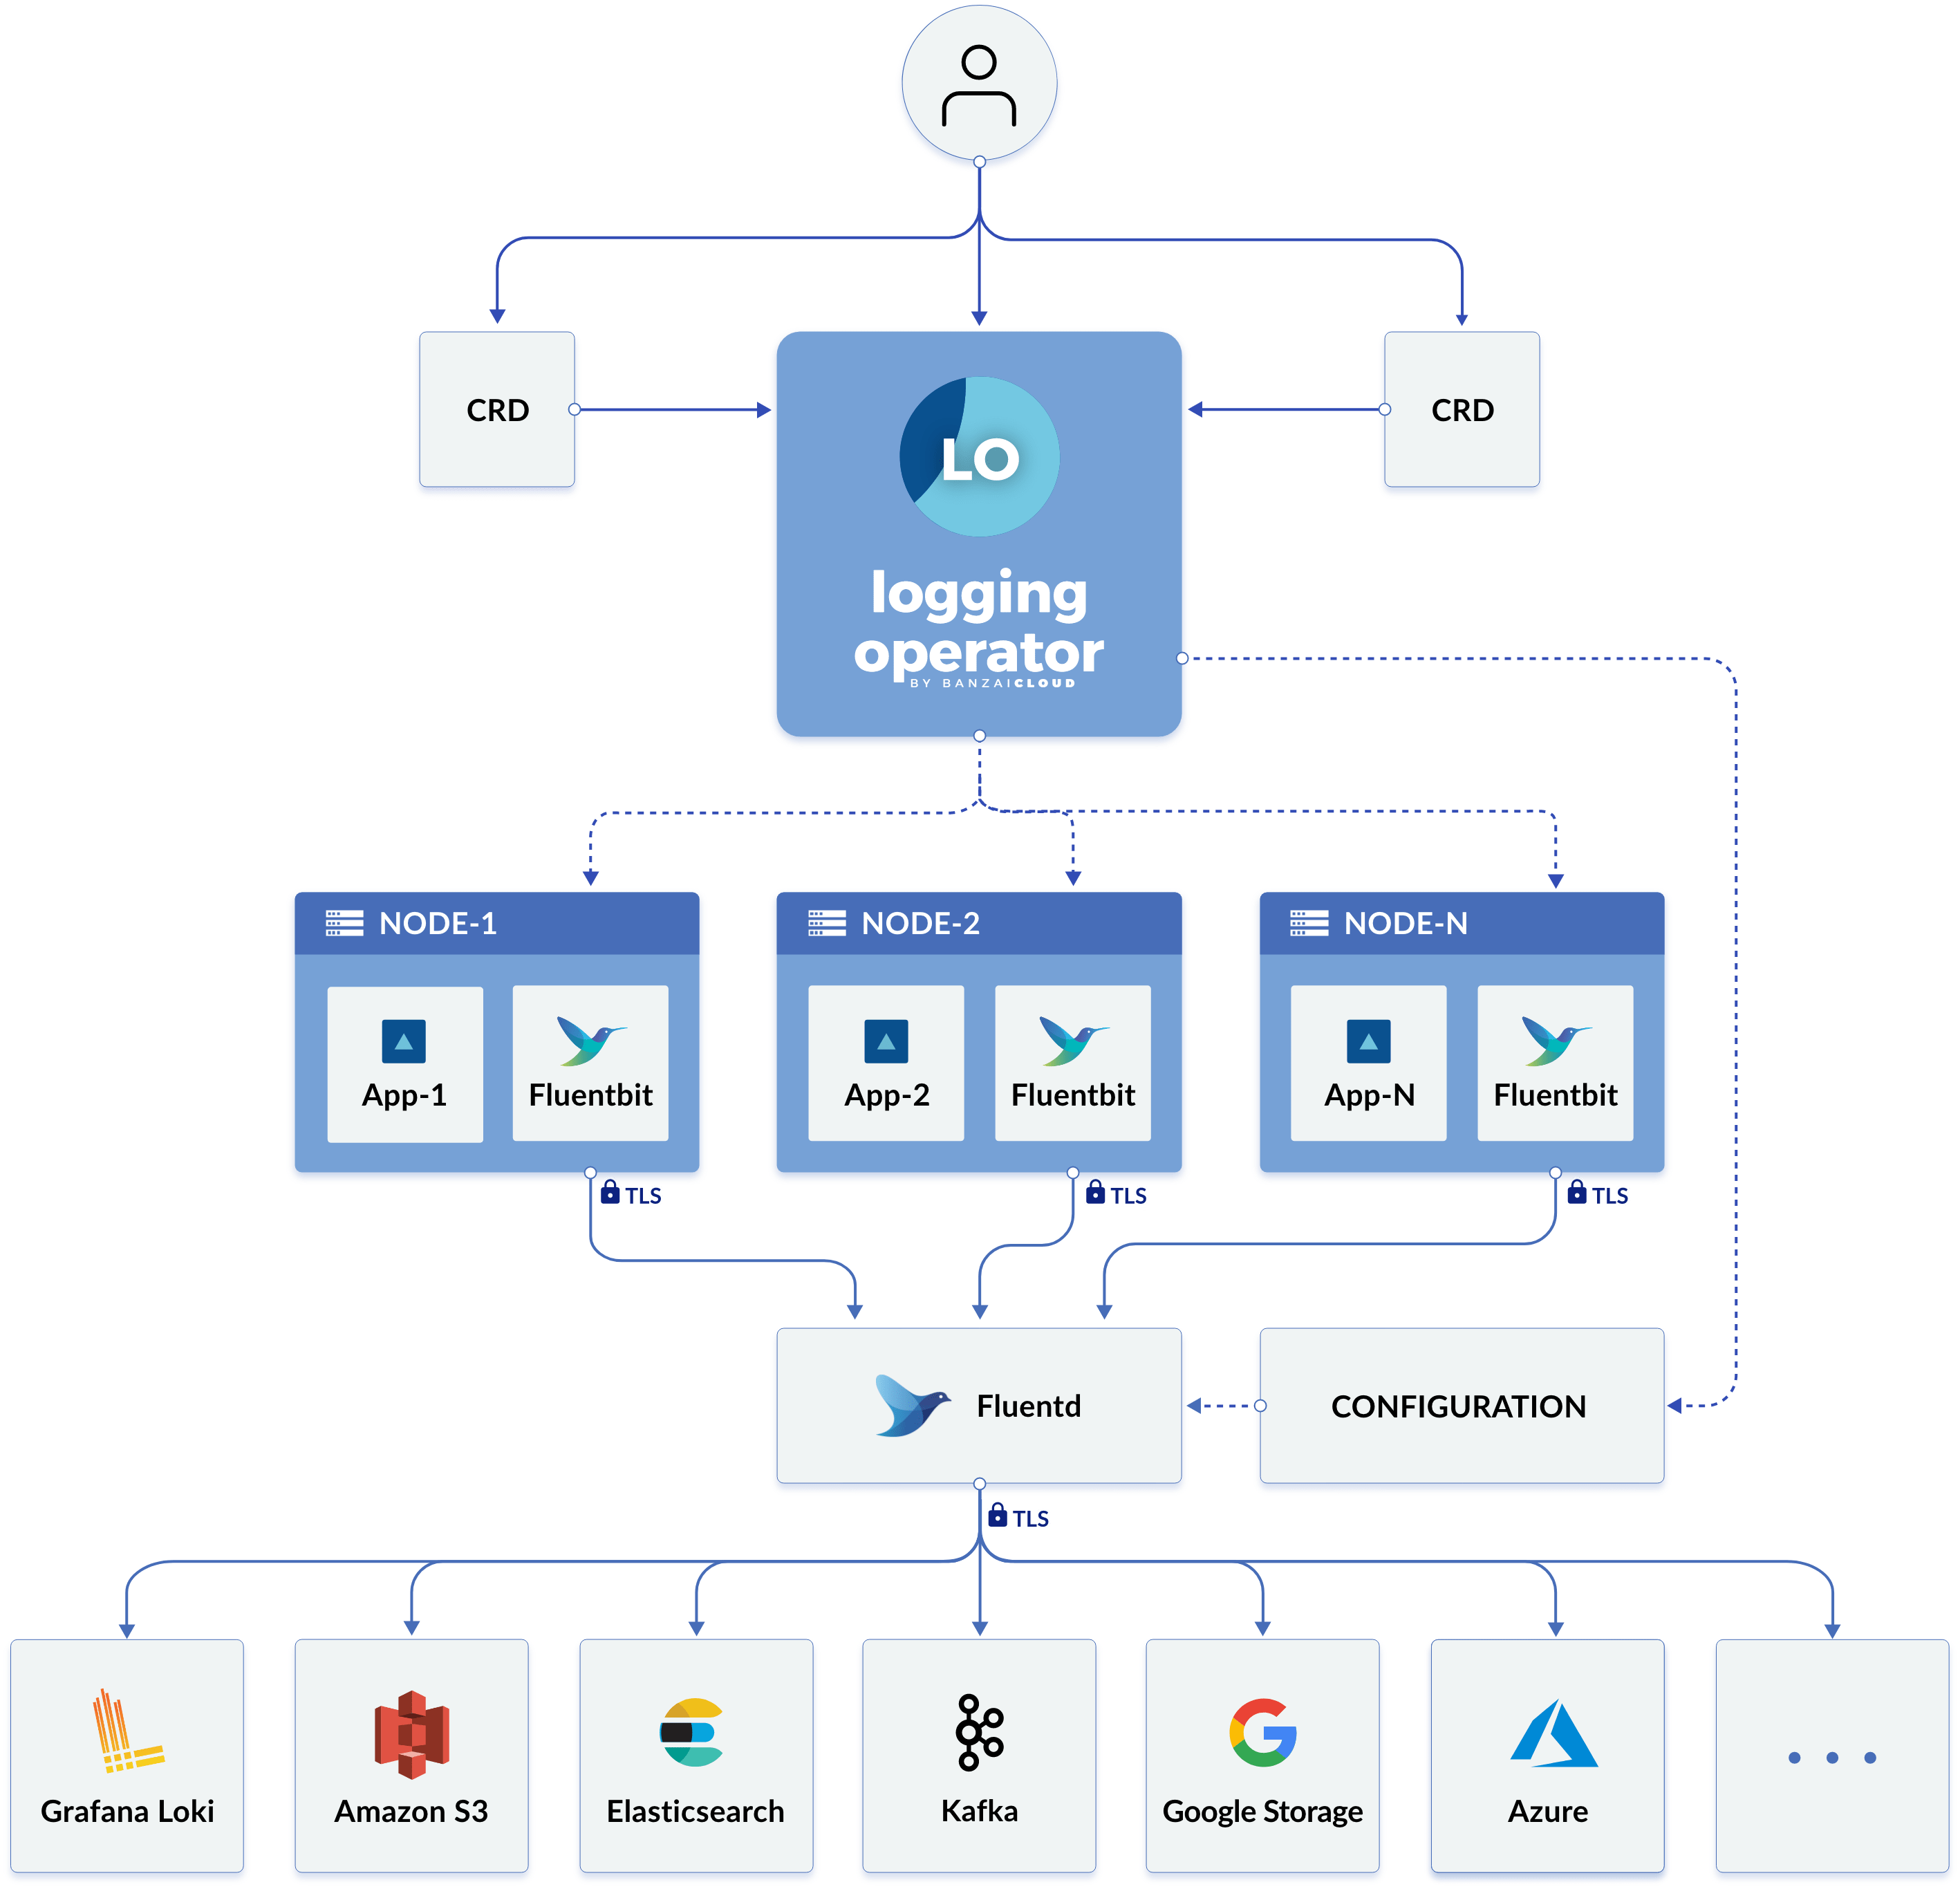
logging operator

Features

  • EFK stack :
    • Elasticsearch
    • FluenBit / Fluentd
    • Kibana

Requirements :

Setting up the environment

1 - Installing Elasticsearch

  1 - In the Rancher UI, go to the cluster where you want to install logging and click Cluster Explorer.
  2 - Click Apps.
  3 - Click the elasticsearch app.
  4 - In the elasticsearch configuration modify :
     * replicas 3 
     * minimaster nodes 2 
  5 - Scroll to the bottom of the Helm chart README and click Install.

2- Installing Kiabana

  1 - In the Rancher UI, go to the cluster where you want to install logging and click Cluster Explorer.
  2 - Click Apps.
  3 - Click the elasticsearch app.
  4 - Scroll to the bottom of the Helm chart README and click Install.

3 - Enabling Logging for Rancher Managed Clusters

  1 - In the Rancher UI, go to the cluster where you want to install logging and click Cluster Explorer.
  2 - Click Apps.
  3 - Click the logging app.
  4 - Scroll to the bottom of the Helm chart README and click Install.

Configuring the Logging Application

To configure the logging application, go to the Cluster Explorer in the Rancher UI. In the upper left corner, click Cluster Explorer > Logging.

1 - Create Cluster Output :

Cluster Output

  • Leave other configuration as default .

2 - Create Custerflow :

Cluster Flow

  • Leave other configuration as default .

3 - Configure Cluster Output in Rancher Cluster manager :

  • Select tools --> logging
    • Choose Elasticsearch
    • Endpoint :
    • Index Pattern Prefix :
    • Click test to ensure that the configuration is ok .
    • Click save

Configuring Kibana Dashboard

Go to : https://kibana.platosystem.io/

1 - add the "_time" metafield :

  * Under Management Click Stack Management
  * Under Kibana Click Avanced settings
  * Scroll down to metafields and add _time

Kibana metafield 2 - Create index Pattern :

  * Under Management Click Stack Management
  * Under Kibana Click Index patterns
  * Click Create index pattern and choose the index written in the cluster manager previously
  * choose _time time field
  * Click Create Index Pattern

Then Go to discover under Analytics , there you can see the logs generated .

Discover

Kiabana Dashboard :

Dashboard ter

ibrahachraf's Projects

efk icon efk

open-source log collector

elk icon elk

Supporting Repo for ELK installation Youtube video

Recommend Projects

  • React photo React

    A declarative, efficient, and flexible JavaScript library for building user interfaces.

  • Vue.js photo Vue.js

    🖖 Vue.js is a progressive, incrementally-adoptable JavaScript framework for building UI on the web.

  • Typescript photo Typescript

    TypeScript is a superset of JavaScript that compiles to clean JavaScript output.

  • TensorFlow photo TensorFlow

    An Open Source Machine Learning Framework for Everyone

  • Django photo Django

    The Web framework for perfectionists with deadlines.

  • D3 photo D3

    Bring data to life with SVG, Canvas and HTML. 📊📈🎉

Recommend Topics

  • javascript

    JavaScript (JS) is a lightweight interpreted programming language with first-class functions.

  • web

    Some thing interesting about web. New door for the world.

  • server

    A server is a program made to process requests and deliver data to clients.

  • Machine learning

    Machine learning is a way of modeling and interpreting data that allows a piece of software to respond intelligently.

  • Game

    Some thing interesting about game, make everyone happy.

Recommend Org

  • Facebook photo Facebook

    We are working to build community through open source technology. NB: members must have two-factor auth.

  • Microsoft photo Microsoft

    Open source projects and samples from Microsoft.

  • Google photo Google

    Google ❤️ Open Source for everyone.

  • D3 photo D3

    Data-Driven Documents codes.