Comments (3)
 tylcole
commented on July 29, 2024
tylcole
commented on July 29, 2024
As a temporary workaround, I wrote the function collapseBinary() which takes as input a finalfit output dataframe
In:
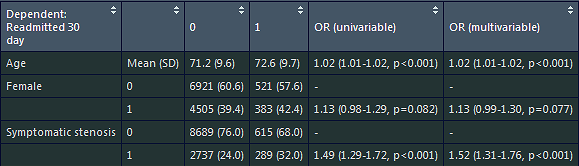
Out:

Function:
collapseBinary = function(.data) {
emptyRows = which(.data[,2] == "0")
.data[emptyRows, 2:6] = .data[(emptyRows + 1), 2:6]
.data = .data[-(emptyRows + 1),]
replaceWithBlank = which(.data[,2] == "1")
.data[replaceWithBlank, 2] = ""
return(.data)
}
Use:
collapsedTable = tableToCollapse %>% collapseBinary()
You may have to change whatever your binary labels are, like "No" and "Yes" instead of "0" and "1"
Hope it helps until there's something more general incorporated in the function! This would also be great for the OR plots
from finalfit.
 ewenharrison
commented on July 29, 2024
ewenharrison
commented on July 29, 2024
Hi,
Many thanks for you interest and work on this. One of the advantages of the finalfit dataframe is that it can be edited on the fly. So rather than adding extra options to the original functions, I've added a quick helper function ff_remove_ref which will remove the rows for you. It should work with all flavors of regression and factor levels.
You can install the github version of finalfit to access this.
Example:
explanatory = c("age.factor", "age", "sex.factor", "nodes", "obstruct.factor", "perfor.factor")
dependent = 'mort_5yr'
colon_s %>%
	finalfit(dependent, explanatory, add_dependent_label = FALSE) %>%
	ff_remove_ref() %>%
	dependent_label(colon_s, dependent)
Altering the OR plot can be done in a similar manner. This isn't as straightfoward and some examples will be added to future vignettes. A new "factorlist" object is created only containing the levels of interest, which is then passed to or_plot().
Example:
colon_s %>%
	summary_factorlist(dependent, explanatory, total_col = TRUE, fit_id=TRUE) %>%
	ff_merge(
		glmuni(colon_s, dependent, explanatory) %>%
			fit2df()) %>%
	ff_remove_ref() %>%
	select(-`OR`) -> factorlist_plot

colon_s %>%
	or_plot(dependent, explanatory, factorlist = factorlist_plot)
ff_merge() is very flexible, and multiple columns can be added to a regression table using it. I'll pop a comment on your other post about that. Thanks again. Let me know if anything doesn't work.
from finalfit.
tylcole
commented on July 29, 2024
That's great, thank you!
from finalfit.
Related Issues (20)
- finalfit does not show median, only mean HOT 1
- inverse OR in finalfit in R continuation closed event
- Fine-gray model visualization HOT 2
- Extending cont_cut to or_plot HOT 1
- Adjust axes for coef plots? HOT 1
- Multinomial Logistic Regression HOT 4
- About modifying the hr_plot function HOT 3
- Error with or_plot HOT 2
- `fct_explicit_na()` was deprecated in forcats 1.0.0 HOT 1
- missing_compare - discrepancy in the manual (Kruskal-Wallis) HOT 1
- `Namespace in Imports field not imported from: ‘tidyselect’` HOT 1
- The output from the stratified models example does not align with the results of the stratified Cox model. HOT 4
- Table format of the finalfit output only gives HTML format script HOT 4
- Potential bugs finalfit command HOT 1
- Finalfit package: Descriptive statistics query for p values and getting Median as statistics HOT 1
- p>0.05, but 95% confidence interval for the odds ratio DOES NOT include 1. How can I check and standardise the methods used to calculate the p-values and confidence intervals? HOT 2
- ff_remove_ref for summaryfactorlist HOT 4
- finalfit results in table with "Coefficient" instead of "OR" HOT 3
- ff_plot with interaction HOT 2
- Feature Request: Random effect in univariable models HOT 3
Recommend Projects
-
 React
React
A declarative, efficient, and flexible JavaScript library for building user interfaces.
-
Vue.js
🖖 Vue.js is a progressive, incrementally-adoptable JavaScript framework for building UI on the web.
-
 Typescript
TypeScript is a superset of JavaScript that compiles to clean JavaScript output.
-
TensorFlow
An Open Source Machine Learning Framework for Everyone
-
Django
The Web framework for perfectionists with deadlines.
-
 Laravel
A PHP framework for web artisans
-
D3
Bring data to life with SVG, Canvas and HTML. 📊📈🎉
-
Recommend Topics
-
javascript
JavaScript (JS) is a lightweight interpreted programming language with first-class functions.
-
web
Some thing interesting about web. New door for the world.
-
server
A server is a program made to process requests and deliver data to clients.
-
Machine learning
Machine learning is a way of modeling and interpreting data that allows a piece of software to respond intelligently.
-
Visualization
Some thing interesting about visualization, use data art
-
Game
Some thing interesting about game, make everyone happy.
Recommend Org
-
Facebook
We are working to build community through open source technology. NB: members must have two-factor auth.
-
Microsoft
Open source projects and samples from Microsoft.
-
Google
Google ❤️ Open Source for everyone.
-
Alibaba
Alibaba Open Source for everyone
-
D3
Data-Driven Documents codes.
-
Tencent
China tencent open source team.
from finalfit.