Comments (18)
 gionkunz
commented on July 17, 2024
8
gionkunz
commented on July 17, 2024
8
Hi there and thanks! :-) They get a default class that is generated. ct-series-a, ct-series-b, ct-series-c etc. You can also override by using the object series notation:
var data = {

    //my labels
    labels: ['Mon', 'Tue', 'Wed', 'Thu', 'Fri'],

    //my multiple series
    series: [
        //series1: label example: apples
        {
          className: 'apples',
          name: 'My nice apples',
          data: [5, 2, 4, 2, 0],
        },
        {
        //series1: label example: lemons
          className: 'lemons',
          name: 'My nice lemons',
          data: [8, 1, 14, 12, 10],
        }
    ]
};
Then you'll have two things available, first a class will be set on a group above the form elements (series group) as well as some custom attributes on your element containing the original data values. You can also check the new advanced example to attach behavior: http://gionkunz.github.io/chartist-js/getting-started.html#adding-behavior-to-your-charts
from chartist.
gionkunz
commented on July 17, 2024
4
@wgbn search for chartist label plugin on NPM / Github.
from chartist.
gionkunz
commented on July 17, 2024
1
@Timmmm Again, Chartist was created with the principle to keep a very strong separation of concerns. However, if you'd like to make your chart dynamic and use behavior to change your chart appearance, you can make use of the reactive event model in Chartist.
Your example could simply be implemented with the following code:
http://jsbin.com/xusinu/1/edit?css,js,output
I hope this helps.
Cheers
Gion
from chartist.
 vlasvlasvlas
commented on July 17, 2024
vlasvlasvlas
commented on July 17, 2024
woow thanks alot! :)
from chartist.
gionkunz
commented on July 17, 2024
You're welcome!
from chartist.
vlasvlasvlas
commented on July 17, 2024
and how can i force to use specific color for each line (lemons = yellow line; apples: red line)? thanks!
from chartist.
gionkunz
commented on July 17, 2024
You need to use css. Check the chartist css to see what styles are applied. I recommend to inspect your chart in the browser dev tools. You can use various style attributes for svg. Chack this article by Jakob Jenkov which is a great summary http://tutorials.jenkov.com/svg/svg-and-css.html
from chartist.
 dominicrico
commented on July 17, 2024
dominicrico
commented on July 17, 2024
You can add them via the css .ct-chart .ct-series.ct-series-a .ct-line and .ct-chart .ct-series.ct-series-a .ct-point just change the stroke to the color you
want and the series .ct-series-a, .ct-series-b, ... to different colors.
ct-series-a would be your lemons and ct-series-b your apples
from chartist.
vlasvlasvlas
commented on July 17, 2024
waw thanks!
if i follow the ClassName example:
{
          className: 'apples',
          name: 'My nice apples',
          data: [5, 2, 4, 2, 0],
        },
        {
        //series1: label example: lemons
          className: 'lemons',
          name: 'My nice lemons',
          data: [8, 1, 14, 12, 10],
        }
then my CSS .ct-series-a, ct-series-b wil also be replaced by 'apples', 'lemons'?
from chartist.
 Timmmm
commented on July 17, 2024
Timmmm
commented on July 17, 2024
It would be nice if there was also a way to specify the line style in javascript, without using CSS. This would be useful if you want the style to represent data.
from chartist.
gionkunz
commented on July 17, 2024
@Timmmm, styling in JavaScript is against the core principle of Chartist to keep a clean separation of concerns. If you need to dynamically style your element you can use the draw events of Chartist.
from chartist.
Timmmm
commented on July 17, 2024
@gionkunz I understand what you mean - you want the line style to literally be part of the website style. However sometimes the line style can be used to convey information about the data itself, which is handled in javascript. For example how would you do this chart in chartist?:
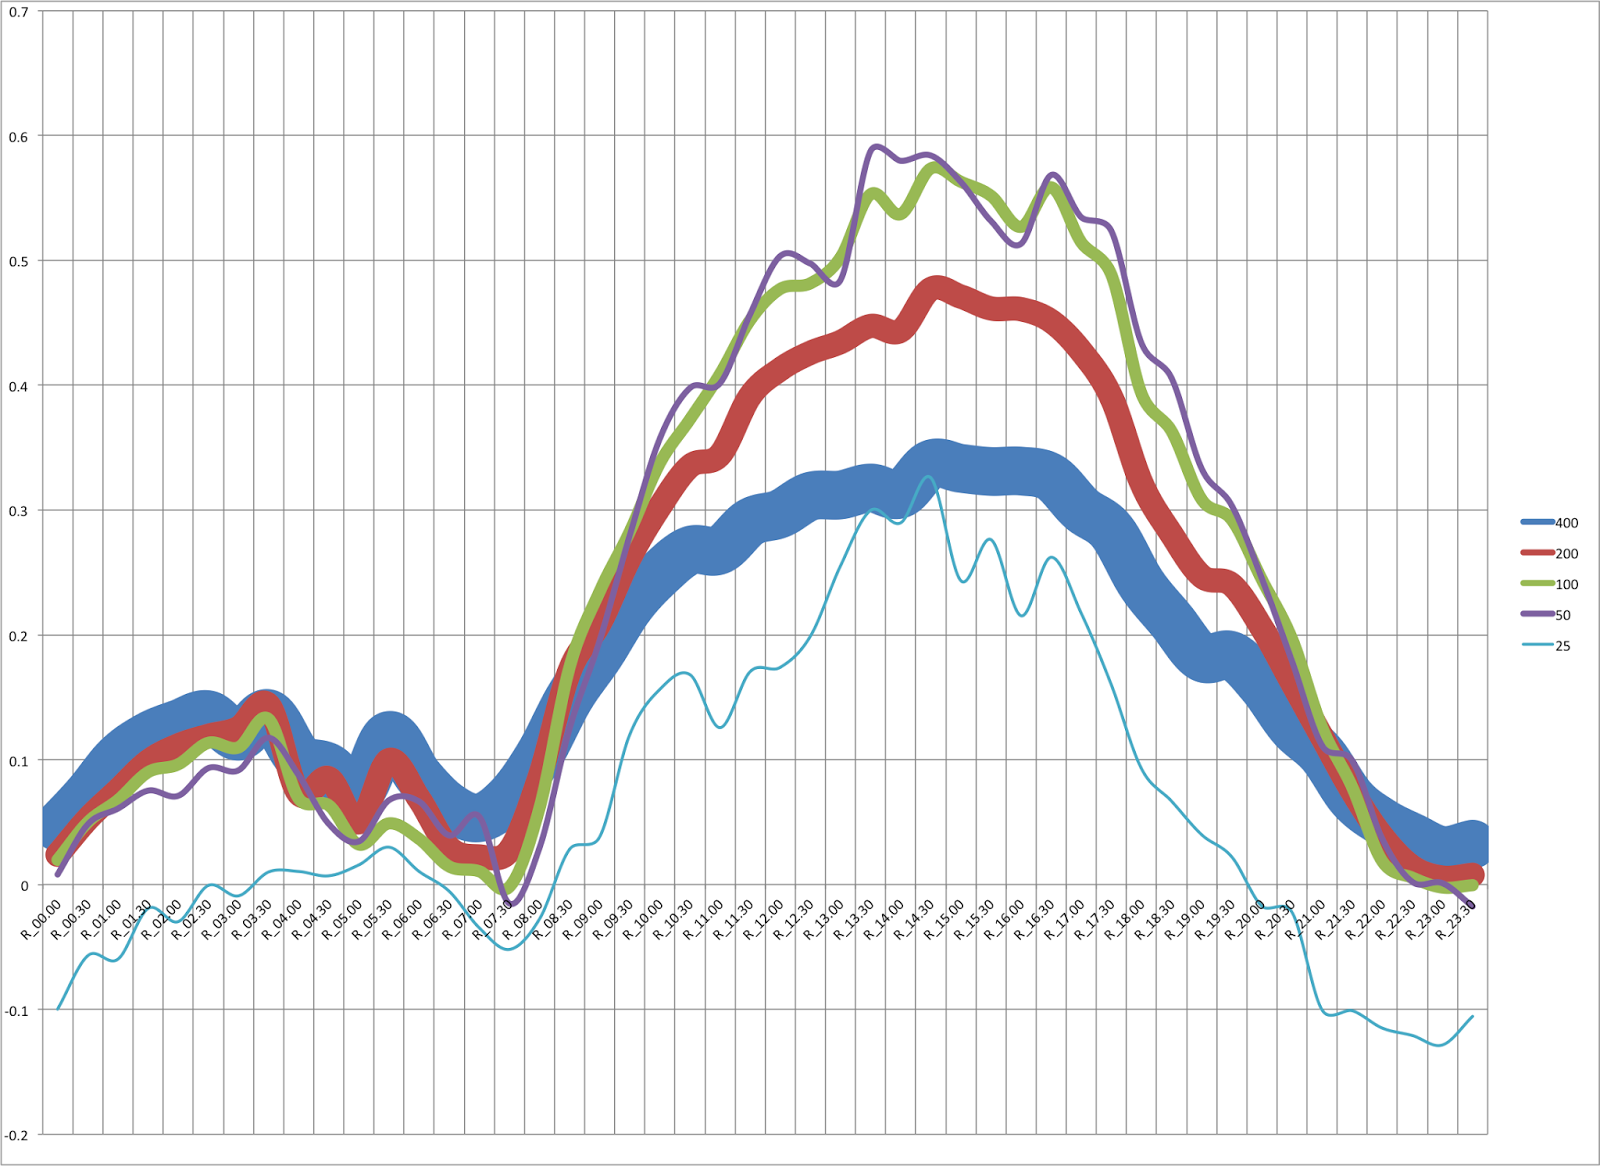
(Assuming that you did not know the widths in advance. Not the best example but you get the idea.)
In my case the graph lines are literally related to colours, so it would be nice to be able to just directly set the line colour to be the same as the colour that the line represents.
from chartist.
Timmmm
commented on July 17, 2024
Great example, that'll do nicely thanks!
from chartist.
vlasvlasvlas
commented on July 17, 2024
txs!!
from chartist.
 lkallioniemi
commented on July 17, 2024
lkallioniemi
commented on July 17, 2024
How would you do this sort of bar chart coloring, where items under certain label would be color coordinated? http://www.politiko.dk/barometeret
from chartist.
gionkunz
commented on July 17, 2024
@lkallioniemi I guess this is a different use case where you display series along the X axis instead of drawing all series per step on the X axis. For this sort of bar chart you'd need to specify two series (poll one and poll two) and specify the paries as labels. Using the draw events like in this example http://jsbin.com/xusinu/1/edit?css,js,output you can then apply the colors to the bars.
from chartist.
 wgbn
commented on July 17, 2024
wgbn
commented on July 17, 2024
I have this script:
var options = {
    plugins: [
        Chartist.plugins.ctPointLabels({
            labelClass: 'ct-label',
            textAnchor: 'middle',
            labelInterpolationFnc: function(value) {
                return value.toFixed(2)+'kg';
            }
        })
    ],
    showPoint: true,
    lineSmooth: false,
    axisY: {
        labelInterpolationFnc: function(value) {
            return value + 'kg';
        }
    }
};
var data = {
    labels: ['Maio', 'Junho', 'Julho', 'Agosto'],
    series: [
        {
            name: 'oleo',
            data: [2.7, 2.6, 1.9, 1.5]
        },
        {
            name: 'margarina',
            data: [4.2, 4.5, 3.4, 2.8]
        },
        {
            name: 'acucar',
            data: [11.3, 11.2, 7.2, 5.7]
        }
    ]
};
new Chartist.Line('.ct-chart', data, options);
but the subtitles of series don't show like a example of @Timmmm !!!! why?
from chartist.
 CodeMasterZeroOne
commented on July 17, 2024
CodeMasterZeroOne
commented on July 17, 2024
Hello, this is a great chart. I just have a question about this. I was trying to hide a line onClick, how would I accomplish that? I tried to document.getElementsByClassName('ct-series-a').style.visibility = 'hidden' but this didn't fount that class.
from chartist.
Related Issues (20)
- [Bug]: More descriptive error message when DOM node for container was not found
- [Bug]: SASS styling no longer available HOT 8
- Please provide a `dist` folder at the root of the repository HOT 1
- [Bug]: Can't import `index.css` HOT 1
- [Bug]: package.json: conflict between `puppeteer` and `@storybook/addon-storyshots-puppeteer` HOT 1
- Do not set Chart.svg as protected or allow direct access in some other way
- Implement SVG graphics export HOT 1
- precompiled releases again like before HOT 3
- [Bug]: Using responsive options fails on some browsers
- [Bug]: old website linked in repo HOT 1
- Please provide a standalone example (HTML/CSS/JS) of Chartist 1.0+ in action HOT 2
- Support for viewBox for scalable and responsive charts
- [Bug]: Pulling from CDN gives latest 0.x.x version HOT 4
- Support dual Y-Axis HOT 1
- barstack with label on bar
- [Bug]: Error: ENOENT: no such file or directory, open '\node_modules\chartist\src\styles\index.scss'
- Support plot legends
- [Bug]: Invalid Homepage Link on npm
- NodeJS JSDOM support - ability to render on the backend
- [Bug]: Prototype Pollution Vulnerability Affecting chartist module, versions >=1.0.0 <=1.3.0
Recommend Projects
-
 React
React
A declarative, efficient, and flexible JavaScript library for building user interfaces.
-
Vue.js
🖖 Vue.js is a progressive, incrementally-adoptable JavaScript framework for building UI on the web.
-
 Typescript
TypeScript is a superset of JavaScript that compiles to clean JavaScript output.
-
TensorFlow
An Open Source Machine Learning Framework for Everyone
-
Django
The Web framework for perfectionists with deadlines.
-
 Laravel
A PHP framework for web artisans
-
D3
Bring data to life with SVG, Canvas and HTML. 📊📈🎉
-
Recommend Topics
-
javascript
JavaScript (JS) is a lightweight interpreted programming language with first-class functions.
-
web
Some thing interesting about web. New door for the world.
-
server
A server is a program made to process requests and deliver data to clients.
-
Machine learning
Machine learning is a way of modeling and interpreting data that allows a piece of software to respond intelligently.
-
Visualization
Some thing interesting about visualization, use data art
-
Game
Some thing interesting about game, make everyone happy.
Recommend Org
-
Facebook
We are working to build community through open source technology. NB: members must have two-factor auth.
-
Microsoft
Open source projects and samples from Microsoft.
-
Google
Google ❤️ Open Source for everyone.
-
Alibaba
Alibaba Open Source for everyone
-
D3
Data-Driven Documents codes.
-
Tencent
China tencent open source team.
from chartist.