Git Product home page Git Product logo

vega's Introduction

Vega: A Visualization Grammar

Vega Examples

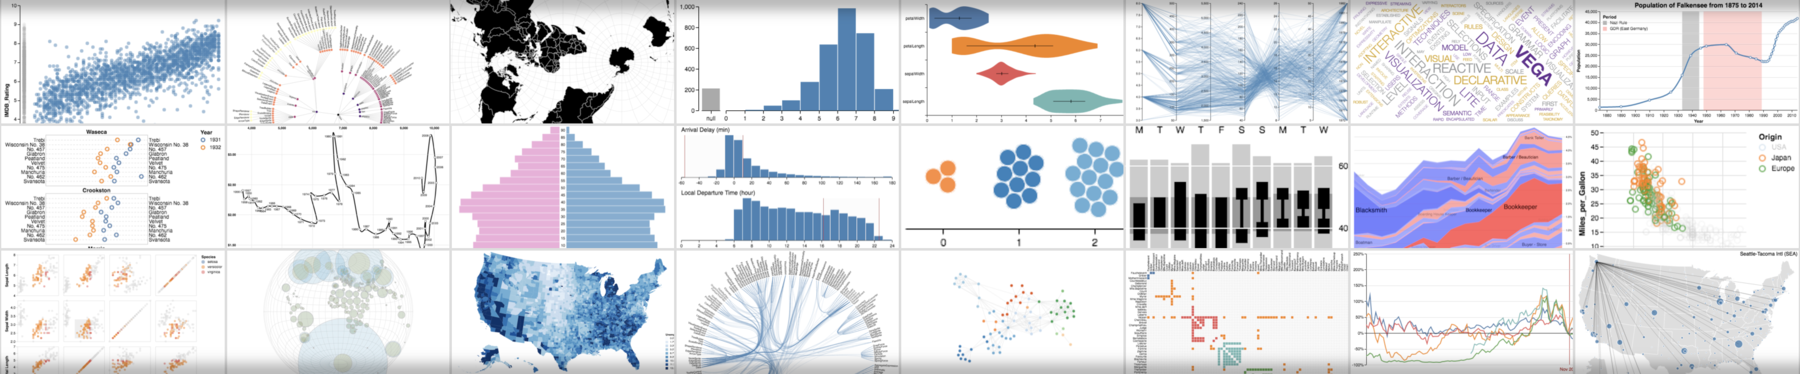
Vega is a visualization grammar, a declarative format for creating, saving, and sharing interactive visualization designs. With Vega you can describe data visualizations in a JSON format, and generate interactive views using either HTML5 Canvas or SVG.

For documentation, tutorials, and examples, see the Vega website. For a description of changes between Vega 2 and later versions, please refer to the Vega Porting Guide.

Build Instructions

For a basic setup allowing you to build Vega and run examples:

  • Clone https://github.com/vega/vega.
  • Run yarn to install dependencies for all packages. If you don't have yarn installed, see https://yarnpkg.com/en/docs/install. We use Yarn workspaces to manage multiple packages within this monorepo.
  • Once installation is complete, run yarn test to run test cases, or run yarn build to build output files for all packages.
  • After running either yarn test or yarn build, run yarn serve to launch a local web server — your default browser will open and you can browse to the "test" folder to view test specifications.

This repository includes the Vega website and documentation in the docs folder. To launch the website locally, first run bundle install in the docs folder to install the necessary Jekyll libraries. Afterwards, use yarn docs to build the documentation and launch a local webserver. After launching, you can open http://127.0.0.1:4000/vega/ to see the website.

Internet Explorer Support

For backwards compatibility, Vega includes a babel-ified IE-compatible version of the code in the packages/vega/build-es5 directory. Older browser would also require several polyfill libraries:

<script src="https://cdnjs.cloudflare.com/ajax/libs/babel-polyfill/7.4.4/polyfill.min.js"></script>
<script src="https://cdn.jsdelivr.net/npm/[email protected]/runtime.min.js"></script>
<script src="https://cdn.jsdelivr.net/npm/[email protected]/dist/fetch.umd.min.js"></script>

Contributions, Development, and Support

Interested in contributing to Vega? Please see our contribution and development guidelines, subject to our code of conduct.

Looking for support, or interested in sharing examples and tips? Post to the Vega discussion forum or join the Vega slack organization! We also have examples available as Observable notebooks.

If you're curious about system performance, see some in-browser benchmarks. Read about future plans in our roadmap.

vega's People

Contributors

afdta avatar arvind avatar benib avatar challet avatar chanwutk avatar danmarshall avatar dependabot-preview[bot] avatar dependabot[bot] avatar domoritz avatar dvmoritzschoefl avatar emilygu avatar giammaria avatar greenkeeper[bot] avatar hydrosquall avatar invokesus avatar jerrythafast avatar jheer avatar jonmmease avatar kanitw avatar kristw avatar lgrammel avatar lsh avatar malecki avatar marcprux avatar mcnuttandrew avatar nyurik avatar pbi-david avatar pelotom avatar russellsprouts avatar ydlamba avatar

Stargazers

 avatar  avatar  avatar  avatar  avatar  avatar  avatar  avatar  avatar  avatar  avatar  avatar  avatar  avatar  avatar  avatar  avatar  avatar  avatar  avatar  avatar  avatar  avatar  avatar  avatar  avatar  avatar  avatar  avatar  avatar  avatar  avatar  avatar  avatar  avatar  avatar  avatar  avatar  avatar  avatar  avatar  avatar  avatar  avatar  avatar  avatar  avatar  avatar  avatar  avatar  avatar  avatar  avatar  avatar  avatar  avatar  avatar  avatar  avatar  avatar  avatar  avatar  avatar  avatar  avatar  avatar  avatar  avatar  avatar  avatar  avatar  avatar  avatar  avatar  avatar  avatar  avatar  avatar  avatar  avatar  avatar  avatar  avatar  avatar  avatar  avatar  avatar  avatar  avatar  avatar  avatar  avatar  avatar  avatar  avatar  avatar  avatar  avatar  avatar  avatar

Watchers

 avatar  avatar  avatar  avatar  avatar  avatar  avatar  avatar  avatar  avatar  avatar  avatar  avatar  avatar  avatar  avatar  avatar  avatar  avatar  avatar  avatar  avatar  avatar  avatar  avatar  avatar  avatar  avatar  avatar  avatar  avatar  avatar  avatar  avatar  avatar  avatar  avatar  avatar  avatar  avatar  avatar  avatar  avatar  avatar  avatar  avatar  avatar  avatar  avatar  avatar  avatar  avatar  avatar  avatar  avatar  avatar  avatar  avatar  avatar  avatar  avatar  avatar  avatar  avatar  avatar  avatar  avatar  avatar  avatar  avatar  avatar  avatar  avatar  avatar  avatar  avatar  avatar  avatar  avatar  avatar  avatar  avatar  avatar  avatar  avatar  avatar  avatar  avatar  avatar  avatar  avatar  avatar  avatar  avatar  avatar  avatar  avatar  avatar  avatar  avatar

vega's Issues

zip transform does not allow no key on with

As far as I can tell, there is not a transform available that allows copying from something like a total stats transform into all the values of the dataset. For instance on the barley.json example, if we calculate stats on an aggregate level into "totalstats" through

    {
       "name" : "totalstats",
       "source" : "barley",
       "transform" : [
           {"type" : "stats", "value" : "data.yield"},
           {"type" : "zip", "with" : "barley"}
       ]
    }

and then we would like to use a formula transform using the totalstats fields such as mean on the data faceted by site, then there is no way to access this data. I thought I could use

        {"type": "zip", "with":"totalstats"},    

but that only zips with the Waseca or key 0. Is there a way to accomplish this other than a potentially modified zip transform? I'm sure I am introducing a new bug, but maybe something like this:

  function zip(data, db) {
    var zdata = db[z], d, i, len, map;

    if (withKey) {
      map = {};
      zdata.forEach(function(s) { map[withKey(s)] = s; });
    }

    for (i=0, len=data.length; i<len; ++i) {
      d = data[i];
      //if there is no key on zdata and length is 0 we know there is no real match
     //can we assume then that user wants every value in the target to receive the zip object
      if(key(zdata) & zdata.length > 0) {
          d[as] = map ? map[key(d)] : zdata[i];
      } else {
          d[as] = zdata[0];
      }
    }

    return data;
  }

Thanks.

Automatic padding based on the length of axis labels

It would be nice if there was an "auto" padding option that would measure all of the axis labels to determine a good default size. It could also take a "max" option in order to handle the case of a stray long ordinal label.

"interact" property set for Marks or adding "click" events

Marks have an optional property set "hover" to visualize a basic interaction on top of the visualization however the set of interactions will expand overtime, it might be more valuable to create a fourth primary mark property set that would cover all optional interactions with the data.

The hover interaction is already introduced but considered an optional primary property. While a click interaction could be added there it might be more beneficial to nest them together.

The primary issue I have with adding this is understanding if small interactions (go to a webpage, click one component to re-render with new data) or lightweight interactive visualizations are inline with vega's value to the community and roadmap.

I'd love to help add this to the library but before I attempt to, I'd prefer to begin a discussion here on the complexities involved.

d3.time.format for

I think it'd be helpful to

maybe as a separate axes key:

{"type": "x", "scale": "x", "format": "%x" }

{"type": "x", "scale": "x", "datetimeFormat": "%x" }

if format contains .%

%[]

More flexible categorical scales

Currently categorical scales have a fixed number of possible values - this makes it challenging to provide good output as the number of values varies. For example, it's nice to be able to use a colour scheme that uses evenly spaced hues on a colour wheel, but there's currently no way to do that in vega.

I'm not sure what a good interface good be: either vega could provide a wider set of palette functions take a single input (the number of levels) and return a vector of values; or you could provide an array of arrays, then pick the array with the same number of value as levels in the data.

(Without this, I don't see any general way of rendering the majority of ggplot2 categorical scales)

How to zoom?

I draw some maps using the geojson. But their position and size are not proper, so I want to how is there any way to zoom the view? (just like the google map)

And I notice that there is zoom behaviour in D3 (https://github.com/mbostock/d3/wiki/Zoom-Behavior), but I don't know how to use it in Vega.

Bar + line chart

I created a sample bar + line chart with two y-axes - I thought it would be interesting to see how it would look like:

https://gist.github.com/itay/a7f5fcf28545607ecd81

Most of it was not particularly difficult, but it did show a bug in Vega: if you do not filter out the GOOG stocks then you will get an exception, as GOOG does not have all the data for the entire time range. I think Vega should be able to handle this.

Happy to make a pull request to get this added.

Cannot update an existing view with new transforms

Being able to update a vega view with the data() function is handy for maintaining object constancy using animated transitions, but it would be nice if you could also update the transforms as well.

I find the syntax for the data() function a bit confusing: in the vega spec, data is an element like:

"data": [ { "name": "some_data_key", "values" : [1,2,3] }]

But the data() function expects data to be in the form:

view.data({ "some_data_key" : [1,2,3] }).update();

If the data() function was changed to accept the same object structure as the vega spec expects, then transforms could be included inline, like:

view.data( [ { "name": "some_data_key", "values" : [1,2,3], "transform" : [ {"type": "filter", "test": "d.data > 10"} ] }] ).update();

Perhaps both syntaxes could be supported: it you pass an object, then the current data() behavior is used, but if you pass an array, then the new suggested behavior would be used.

Links / onClick events

Is it possible to make data elements "clickable", i.e. call a Javascript method or jump to a given link?

404 on vega.css

I copied your example code, which included the line

<link rel="stylesheet" href="http://trifacta.github.com/vega/css/vega.css"/>

Now this file has gone missing. I'm guessing because you decided that you don't want to use CSS that way any more?

The normal way to host libraries on public servers is to version them to avoid exactly this problem. Or if you are going to make the bold simplification of saying "there is only one true version of these files" you need to get a lot more serious about managing compatibility.

Question: How to use Axes Format

I have adapted the basic Bar Chart example to use a date and time axis and it works OK but when I add the format option on the axes I don't get what I'd expect. Any chance you can tell me what I'm doing wrong ?

{
"width": 400,
"height": 200,
"padding": {"top": 10, "left": 30, "bottom": 20, "right": 20},
"data": [
{
"name": "table",
"format": {"type": "json", "parse": {"x": "date"}},
"values": [
{"x":"2013-04-04 09:43", "y":28},
{"x":"2013-04-04 09:44", "y":55},
{"x":"2013-04-04 09:45", "y":43}
]
}
],
"scales": [
{
"name":"x",
"type":"time",
"range":"width",
"domain":{"data":"table", "field":"data.x"}
},
{
"name":"y",
"range":"height",
"nice":true,
"domain":{"data":"table", "field":"data.y"}
}
],
"axes": [
{
"type":"x",
"scale":"x",
"format":"%H:%M"
},
{
"type":"y",
"scale":"y"
}
],
"marks": [
{
"type": "line",
"from": {"data":"table"},
"properties": {
"enter": {
"x": {"scale":"x", "field":"data.x"},
"y": {"scale":"y", "field":"data.y"},
"stroke": { "value": "red" },
"strokeWidth": {"value": 1 }
}
}
}
]
}

Also is this the best place to ask basic usage questions or is there somewhere else ?

Matthew

Is there something wrong with the geo transform?

Hey, I want to use Vega to draw a map and some points on it, but it looks like:
Screenshot_4_28_13_11_48_AM
And the spec is:

{
  "width": 1920,
  "height": 1000,
  "viewport": [1660, 1000],
  "data": [
    {
      "name": "points",
      "values":[
        {"lat":"41.01452809", "lon":"28.97566007"},
        {"lat":"41.01670629", "lon":"28.97012944"},
        {"lat":"41.01823754", "lon":"28.97094827"},
        {"lat":"41.02281326", "lon":"28.97769931"},
        {"lat":"37.95044003", "lon":"27.37236268"},
        {"lat":"38.42064925", "lon":"27.1364795"},
        {"lat":"37.95128245", "lon":"27.3700048"},
        {"lat":"45.5278388", "lon":"-73.57514007"},
        {"lat":"-1.2705402", "lon":"36.8167218"},
        {"lat":"-1.2834895", "lon":"36.81660155"},
        {"lat":"40.71915229", "lon":"-73.99702923"},
        {"lat":"49.26994343", "lon":"-123.1529794"},
        {"lat":"12.61346244", "lon":"77.05839699"},
        {"lat":"45.5277786", "lon":"-73.5752153"},
        {"lat":"45.5277786", "lon":"-73.5752153"},
        {"lat":"45.52773972", "lon":"-73.57525235"},
        {"lat":"46.2330235", "lon":"6.1354609"},
        {"lat":"7.3625", "lon":"55.0195"},
        {"lat":"41.01708247", "lon":"28.96906"},
        {"lat":"38.6426072", "lon":"34.82954294"},
        {"lat":"38.64323285", "lon":"34.8287586"},
        {"lat":"41.00785488", "lon":"28.97655996"},
        {"lat":"-1.2641608", "lon":"36.8040272"},
        {"lat":"-0.1051", "lon":"34.7566"}
      ],
      "transform": [
        {"type": "geo", "lat": "data.lat", "lon": "data.lon", "projection": "mercator", "scale": 200, "translate": [960, 500]}
      ]
    },
    {
      "name": "world",
      "url": "data/world-countries.json",
      "format": {"type": "json", "property": "features"}
    }
  ],
  "scales": [
    {
      "name": "x",
      "range": "width",
      "domain": {"data": "points", "field": "x"}
    },
    {
      "name": "y",
      "range": "height",
      "domain": {"data": "points", "field": "y"},
      "reverse": true
    }
  ],
  "marks": [
    {
      "type": "path",
      "from": {
        "data": "world",
        "transform": [{
          "type": "geopath",
          "value": "data",
          "projection": "mercator",
          "scale": 200,
          "translate": [960, 500]
        }]
      },
      "properties": {
        "enter": {
          "stroke": {"value": "#fff"},
          "path": {"field": "path"}
        },
        "update": {"fill": {"value": "#ccc"}},
        "hover": {"fill": {"value": "pink"}}
      }
    },
    {
      "type": "symbol",
      "from": {
        "data": "points"
      },
      "properties": {
        "enter": {
          "x": {"scale": "x", "field": "x"},
          "y": {"scale": "y", "field": "y"},
          "stroke": {"value": "red"},
          "fill": {"value": "red"}
        },
        "update": {
          "stroke": {"value": "red"},
          "size": {"value": 25}
        },
        "hover": {
          "stroke": {"value": "blue"},
          "size": {"value": 200}
        }
      }
    }
  ]
}

The code I used is up-to-date and I make the demo in the local editor by Vega. It can be reappeared by just copying the spec to your local editor.

And the right result using leaflet looks like:
Screenshot_4_28_13_11_49_AM

Obviously the points are drawn at wrong places, and they seem to be moved from the right place. Although I adjust the translate of transform for points, they can not be draw accurately.

Did I do something wrong? Or there is something wrong with the geo transform?

View: Viewport, Data Window and Padding (Getters?)

In order to support dynamically managing the sizes of the viewport and data window I would like to be able to get the current values of width, height, padding and viewport. The docs indicate that the View properties are set-only. I'd like getters too. I tried getting the padding... with View.padding it was null.

Also the relationship between the viewport, data window and the padding could be clearer. I suggest adding a graphic and some additional explanatory text. After some experimentation it appears the size of the canvas (or svg node) interior to the viewport will be:
canvasWidth = width + padding.left + padding.right
canvasHeight = height + padding.top + padding.bottom

So the Viewport is the size Vega will take up on the screen, the Canvas inside the Viewport will be the size of the data window (width, height) plus any padding. The Viewport will show scroll bars if the canvas (or svg node) overflows. Note that this is slightly different than what's in the docs:
If the viewport size is smaller than the width or height properties, the view component will include scroll bars.

It might be nice to have a way to set/get the canvas (or svg) size directly as well (indirectly setting the data window width and height, while taking the padding into consideration.

rect height parameter seems backwards

I've modified the bar chart example to use "height" instead of "y2", and the parameter values seem backwards from what I expected. My goal was to make the bars into little squares, like this:
image

I expected "height": {"scale": "y", "value": 10} to do this (https://gist.github.com/aflaxman/5440785#file-expected-json), but it turned out "height": {"scale": "y", "value": 90} is what does the trick (https://gist.github.com/aflaxman/5440785#file-workaround-json).

Is this intended? Maybe it is a bug.

Suggestions for undocumented "key" property of mark

I don't see any documentation about it, but the "dynamic.html" example illustrates the "key" property of a mark and its importance for object constancy when the data is altered. I wonder if this property:

  1. Should accept an array of fields rather than just a single field?
  2. Should default to containing any fields that are mapped to an ordinal scale?

As an example of an issue this might address, take a look at http://bl.ocks.org/mprudhom/5456100 and click the three sorting buttons. The chart (which groups the rect marks on "x") will do the right thing when you "Toggle Sort X", but the "Toggle Sort Y" and "Toggle Sort C" buttons have nonsensical object constancy. Being able to key the marks on multiple fields might solve this problem.

Stacked bar doesn't handle negative values

Open the vega editor (http://trifacta.github.io/vega/editor/), select "stacked_bar", and change the first "y" value to be -28 to observe. The problems:

  1. The Y scale doesn't update
  2. The orange bar is overdrawn over the blue bar

It looks like the stack layout isn't taking into account negative values at all. It should take all the negative values and stack them all below the baseline.

Date scales

Date scale support mirroring d3's d3.time.scale would be a valuable addition to vega. This would provide the ability to plot irregularly spaced timeseries information with intelligent axis labeling. The current approach used in the stocks example would not work for this kind of data.
Since there is no way (that i know of) to specify literal dates in either json or csv in a way that js can understand, the scaling should be smart enough to coerce numbers to dates (as millis since epoch as d3 already does), or parse ISO 8601 formatted strings.

Access spec from runtime?

In my app I want to change the domain of a scale when a checkbox is checked. I can do this now by doing the following:

view._model._defs.marks.scales[0].domain = [0, 2];
view.update();

This uses some private fields. Should there be a "correct" way to do this with documented API?

The world countries showing problem

When I use this geoJSON file as my data, countries.geo.json there is something wrong with my result. It looks like:

image

And my code is like this:

<script src="http://d3js.org/d3.v3.min.js"></script>
<script src="http://trifacta.github.com/vega/vega.js"></script>
<script src="http://trifacta.github.com/vega/d3.geo.projection.min.js"></script>
<div id="vis"></div>
<script type="text/javascript">
$(document).ready(function() {
  var show_spec = {
    "width": 1200,
    "height": 650,
    "data": [
      {
        "name": "states",
        "url": "/geojson_sample/countries.geojson",
        "format": {"type": "json", "property": "features"},
        "transform": [
          {"type":"geopath", "value":"data", "projection":"mercator", "scale": 100} 
        ]
      }
    ],
    "scales": [
      {
        "name": "color",
        "type": "linear",
        "range": ["#f5f5f5","#f5f5f5"]
      }
    ],
    "marks": [
      {
        "type": "path",
        "from": {"data": "states"},
        "properties": {
          "enter": {
            "stroke": {"value": "#fff"},
            "strokeWidth": {"value": 1.25},
            "path": {"field": "path"},
            "fill": {"value": "#00bbbb"}
          },
          "update": {
            "fillOpacity": {"value": 1}
          },
          "hover": {
            "fillOpacity": {"value": "0.5"}
          }
        }
      }
    ]
  };
  function parse(spec) {
  vg.parse.spec(spec, function(chart) { chart({el:"#vis"}).update(); });
  }
  parse(show_spec);
});
</script>

I have used the same geoJSON to show the map using leaflet, and it works normally.

So I wonder if I get something wrong?

Fold Transform

We should have a "fold" data transform. It'd make it easier to build stacked bars, and other small multiples, for unfolded data.

Variable transforms

I suspect I'm missing something (so this might actually be more of a documentation bug) - but how do you create new variable that are simple transforms of existing variables? (e.g. x ^ 2, x - y, log(x / y))

Mailing List?

Hello,

Apologies if the link is somewhere, I could not find it.
Is there a mailing list?

Regards
Saptarshi

How much data transformation is vega expected to handle?

Most of the issues that I have submitted all deal with data transformation. Before I submit more, I want to make sure I have a sense of how much data transformation or complex calculation should we expect to happen within vega. In some ways it seems the design and intent of vega inherently limit this ability. By that I mean, when I work with ggplot2, I do not expect ggplot2 to do much data work. Rather, I hand it a transformed data object ready for graphical rendering. I wonder if extensive or difficult calculations should occur outside of vega and then passed to vega in the parse function. I am very comfortable performing these through R or javascript, but after vega was released I thought I would explore how I might replicate these inside of vega.

For instance, in this bl.ocks extension of barley, I wanted to compare yield, yield - site average, and yield - total average. Nothing complicated but maybe outside of scope. Does trying to squeeze all this functionality into vega impair the ability to make it simple?

As another example that I have so far been unable to accomplish within vega, what if we want to draw a cumulative growth line chart of the stocks example like what I did here in d3. This would require the ability to access the price on the first date for each stock. I tried multiple failed methods, but this got me closest.

"data": [
    {
      "name": "stocks",
      "url": "data/stocks.csv",
      "format": {"type": "csv", "parse": {"price": "number"}}
    },
    {
        "name" : "first",
        "source" : "stocks",
        "transform": [ 
            { "type" : "filter","test" : "d.data.date === data[0].data.date;" }
        ]
    }

I really like the clickme ractive integration with vega which allows for R parse, transform, and calculate of data that we can just drop into the vega spec. This feels very intuitive but with this approach we lose the ability to dynamically change the data within the browser, which is one of d3's biggest talents.

I really want to make sure that I'm not a distraction. Thanks so much for all the great work you have done.

Mercator projection in online editor is unhappy.

Try the choropleth example and then replace the "winkel3" projection with "mercator". The result is:

Screen Shot 2013-04-27 at 10 03 09 PM

This does not happen if I clone the repo and run the editor locally in the master branch, but it does happen locally in the gh-pages branch. Copying the latest vega.js from master to gh-pages appears to fix the problem; you might also want to grab the latest d3.geo.projection.v0.min.js from d3js.org.

Marks don't resize on update()

When the view's width or height is changed and update() is called, the axes are re-rendered with the new dimensions, but the marks don't move.

To see the issue in action, add this as the last line of the script tag in the example "interact.html" file and load the file (in Safari, in my case), and resize the window.

window.onresize = function() { 
  view.width(document.body.clientWidth*.5).height(document.body.clientHeight*.5).update();  
};

Add documentation for Development & Contribution

I'm trying to extend some functionality on the data parsers. I think it'll be nice to have some very basic documentation on how to contribute to the project and basic project configuration/build process such as running the test cases or project code organization.

Currently I'm trying to run the test cases using npm test, because I see there's the test script setup in the package.json file, but all test cases are failing, I assume this is not the current state of the project test cases so I wonder what am I missing.

Thanks.

d3.time.format for

I think it'd be helpful to

maybe as a separate axes key:

{"type": "x", "scale": "x", "format": "%x" }

{"type": "x", "scale": "x", "datetimeFormat": "%x" }

if format contains .%

%[]

Vega should draw legends

As well as axes. It might be a good idea to rename the axis component to be more general (e.g. guides)

facet, other types of transform documentation

Documentation suggestion:

I have tried working of the examples to better understand the facet data transformation, but I think the documentation could benefit from a few more inline examples. In my particular case I have struggled with how to access data after it has been faceted. The existing documentation does refer to the 'key' and 'values' but, there are no examples inline. I am able to use 'key', but can't seem to figure out how to get data out/reference data using the 'values' attribute.

zip transform default value?

Subsequent use of a zipped dataset for which some values had no matching withKey results in an error such as:

TypeError: 'undefined' is not an object (evaluating 'item.datum['value']['data']')

Perhaps there could be a 'default:' parameter to specify a value to use if none exists in withKey?

In my example, I'm trying to plot a choropleth where the geojson data contains all countries, but the data to be merged only contains values for a subset of countries. I could regenerate the data with zero values for all other countries, but that feels inefficient.

[Edit to correct where the error is occurring - ie. in the use of incomplete zipped data, not in its creation.]

Need to be able to set Axis width

Currently there is no way to set Axis width explicitly. I think it would be a useful feature to have. If you take a look on my screen shot when I extended width to 300 x Axis extended but everything else remained the same. Was hoping to keep axis the same length too by specifying width
Screenshot-Vega Live Editor - Google Chrome

Scale Default is Linear?

It appears (from the examples) that if scale type is omitted that a linear scale is used.

That the scale type parameter is optional and that linear is the default should be added to the docs/wiki.

Customizable baseline in quantitative scale properties

You can already include zero=true in a quantitive scale (https://github.com/trifacta/vega/wiki/Scales#quantitative-scale-properties), but the baseline for some scales isn't zero. It might be good to instead have a "baseline" option like:

  "scales": [
    {
      "name": "IQ",
      "type": "linear",
      "range": "height",
      "baseline": 100,
      "domain": {"data": "table", "field": "data.intelligence"}
    },
  ],

Implementation would probably be as simple as:

diff --git a/src/parse/scales.js b/src/parse/scales.js
index c9a79f2..da0254b 100644
--- a/src/parse/scales.js
+++ b/src/parse/scales.js
@@ -113,9 +113,10 @@ vg.parse.scales = (function() {
         domain[1] = def.domainMax;
       }
     }
-    if (def.type !== LOG && def.type !== TIME && (def.zero || def.zero===undefi
-      domain[0] = Math.min(0, domain[0]);
-      domain[1] = Math.max(0, domain[1]);
+    if (def.type !== LOG && def.type !== TIME && (def.zero || def.baseline)) {
+      var baseline = def.baseline != undefined ? def.baseline : 0;
+      domain[0] = Math.min(baseline, domain[0]);
+      domain[1] = Math.max(baseline, domain[1]);
     }
     scale.domain(domain);

@@ -175,4 +176,4 @@ vg.parse.scales = (function() {
   }

   return scales;
-})();

Axis ticks should optionally draw grid lines

It is often useful to draw grid lines across the graph in a subtle color aligned with axis ticks, underneath other marks.

The axes components (and their tick-generating functions) don't seem to be available as data to marks, but I think the easiest way would be to add a grid element to axes, and then properties for grid line width, color, etc.

Error installing with node

Newbie with node and not sure where the problem lies. Is this a vega issue or something else?

npm install vegaroot@vividlogic:~# npm install vega
npm http GET https://registry.npmjs.org/vega
npm http 200 https://registry.npmjs.org/vega
npm http GET https://registry.npmjs.org/vega/-/vega-1.2.0.tgz
npm http 200 https://registry.npmjs.org/vega/-/vega-1.2.0.tgz
npm http GET https://registry.npmjs.org/d3/3.1.4
npm http GET https://registry.npmjs.org/canvas/1.0.2
npm http GET https://registry.npmjs.org/optimist/0.3.7
npm http 200 https://registry.npmjs.org/canvas/1.0.2
npm http GET https://registry.npmjs.org/canvas/-/canvas-1.0.2.tgz
npm http 200 https://registry.npmjs.org/d3/3.1.4
npm http GET https://registry.npmjs.org/d3/-/d3-3.1.4.tgz
npm http 200 https://registry.npmjs.org/optimist/0.3.7
npm http GET https://registry.npmjs.org/optimist/-/optimist-0.3.7.tgz
npm http 200 https://registry.npmjs.org/d3/-/d3-3.1.4.tgz
npm http 200 https://registry.npmjs.org/canvas/-/canvas-1.0.2.tgz
npm http 200 https://registry.npmjs.org/optimist/-/optimist-0.3.7.tgz
npm http GET https://registry.npmjs.org/wordwrap
npm http GET https://registry.npmjs.org/jsdom
npm http 200 https://registry.npmjs.org/wordwrap
npm http GET https://registry.npmjs.org/wordwrap/-/wordwrap-0.0.2.tgz
npm http 200 https://registry.npmjs.org/wordwrap/-/wordwrap-0.0.2.tgz
npm http 200 https://registry.npmjs.org/jsdom
npm http GET https://registry.npmjs.org/jsdom/-/jsdom-0.5.7.tgz
npm http 200 https://registry.npmjs.org/jsdom/-/jsdom-0.5.7.tgz
npm http GET https://registry.npmjs.org/nwmatcher
npm http GET https://registry.npmjs.org/cssstyle
npm http GET https://registry.npmjs.org/contextify
npm http GET https://registry.npmjs.org/request
npm http GET https://registry.npmjs.org/htmlparser
npm http GET https://registry.npmjs.org/cssom
npm http 200 https://registry.npmjs.org/nwmatcher
npm http GET https://registry.npmjs.org/nwmatcher/-/nwmatcher-1.3.1.tgz
npm http 200 https://registry.npmjs.org/cssstyle
npm http GET https://registry.npmjs.org/cssstyle/-/cssstyle-0.2.3.tgz
npm http 200 https://registry.npmjs.org/htmlparser
npm http GET https://registry.npmjs.org/htmlparser/-/htmlparser-1.7.6.tgz
npm http 200 https://registry.npmjs.org/cssom
npm http GET https://registry.npmjs.org/cssom/-/cssom-0.2.5.tgz
npm http 200 https://registry.npmjs.org/contextify
npm http GET https://registry.npmjs.org/contextify/-/contextify-0.1.5.tgz
npm http 200 https://registry.npmjs.org/nwmatcher/-/nwmatcher-1.3.1.tgz
npm http 200 https://registry.npmjs.org/cssstyle/-/cssstyle-0.2.3.tgz
npm http 200 https://registry.npmjs.org/htmlparser/-/htmlparser-1.7.6.tgz
npm http 200 https://registry.npmjs.org/cssom/-/cssom-0.2.5.tgz
npm http 200 https://registry.npmjs.org/contextify/-/contextify-0.1.5.tgz
npm http 200 https://registry.npmjs.org/request
npm http GET https://registry.npmjs.org/request/-/request-2.20.0.tgz
npm http 200 https://registry.npmjs.org/request/-/request-2.20.0.tgz
npm WARN [email protected] package.json: bugs['web'] should probably be bugs['url']
npm ERR! error installing [email protected]
npm ERR! error rolling back [email protected] Error: UNKNOWN, unknown error '/root/node_modules/vega/node_modules/d3/node_modules/jsdom'
npm ERR! error installing [email protected]
npm ERR! error rolling back [email protected] Error: UNKNOWN, unknown error '/root/node_modules/vega/node_modules/d3/node_modules/jsdom/node_modules/___htmlparser.npm/package'
npm ERR! error installing [email protected]

npm ERR! Error: ENOENT, no such file or directory '/root/node_modules/vega/node_modules/d3/node_modules/jsdom/node_modules/___nwmatcher.npm/package/README.md'
npm ERR! You may report this log at:
npm ERR! http://github.com/isaacs/npm/issues
npm ERR! or email it to:
npm ERR! [email protected]
npm ERR!
npm ERR! System Linux 2.6.18-028stab101.1
npm ERR! command "node" "/usr/local/bin/npm" "install" "vega"
npm ERR! cwd /root
npm ERR! node -v v0.6.10
npm ERR! npm -v 1.1.0-3
npm ERR! path /root/node_modules/vega/node_modules/d3/node_modules/jsdom/node_modules/___nwmatcher.npm/package/README.md
npm ERR! fstream_path /root/node_modules/vega/node_modules/d3/node_modules/jsdom/node_modules/___nwmatcher.npm/package/README.md
npm ERR! fstream_type File
npm ERR! fstream_class FileWriter
npm ERR! code ENOENT
npm ERR! message ENOENT, no such file or directory '/root/node_modules/vega/node_modules/d3/node_modules/jsdom/node_modules/___nwmatcher.npm/package/README.md'
npm ERR! errno {}
npm ERR! fstream_stack Object.oncomplete (/usr/local/lib/node_modules/npm/node_modules/fstream/lib/writer.js:204:26)

npm ERR! Error: ENOENT, no such file or directory '/root/node_modules/vega/node_modules/d3/node_modules/jsdom/node_modules/___contextify.npm/package/README.md'
npm ERR! You may report this log at:
npm ERR! http://github.com/isaacs/npm/issues
npm ERR! or email it to:
npm ERR! [email protected]
npm ERR!
npm ERR! System Linux 2.6.18-028stab101.1
npm ERR! command "node" "/usr/local/bin/npm" "install" "vega"
npm ERR! cwd /root
npm ERR! node -v v0.6.10
npm ERR! npm -v 1.1.0-3
npm ERR! path /root/node_modules/vega/node_modules/d3/node_modules/jsdom/node_modules/___contextify.npm/package/README.md
npm ERR! fstream_path /root/node_modules/vega/node_modules/d3/node_modules/jsdom/node_modules/___contextify.npm/package/README.md
npm ERR! fstream_type File
npm ERR! fstream_class FileWriter
npm ERR! code ENOENT
npm ERR! message ENOENT, no such file or directory '/root/node_modules/vega/node_modules/d3/node_modules/jsdom/node_modules/___contextify.npm/package/README.md'
npm ERR! errno {}
npm ERR! fstream_stack Object.oncomplete (/usr/local/lib/node_modules/npm/node_modules/fstream/lib/writer.js:204:26)
npm ERR!
npm ERR! Additional logging details can be found in:
npm ERR! /root/npm-debug.log

Encode data keys in SVG marks

In order to integrate a vega visualization with the rest of a web page, it would he handy to be able to match a certain mark with the original data row. For example, a page that contains an HTML table of values and a bar chart of that data could make it so when the mouse is hovered over one of the SVG bars, the corresponding row in the HTML table is highlighted.

One way this might be done would be to use the "key" attribute of the mark and stick them in the generated SVG element using the HTML5 "data-" custom data attribute. E.g., the spec:

{
  "data": [
    {
      "name": "table",
      "values": [
        {"x": 1,  "y": 28}, {"x": 2,  "y": 55},
        ......
       ]
  },
  "marks": [
    {
      "type": "rect",
      "from": {"data": "table"},
      "key": [ "data.x", "data.y" ],
      "properties": {
        "enter": {
          "x": {"scale": "x", "field": "data.x"},
          "width": {"scale": "x", "band": true, "offset": -1},
          "y": {"scale": "y", "field": "data.y"},
          "y2": {"scale": "y", "value": 0}
        },
        "update": {
          "fill": {"value": "steelblue"}
        },
        "hover": {
          "fill": {"value": "red"}
        }
      }
    }
  ]
}

would wind up generating SVG marks like this:

<rect data-x="1" data-y="28" x="53" y="76.5" width="52" height="93" style="fill: #4682b4; "></rect>
<rect data-x="2" data-y="55" x="106" y="96.9" width="52" height="73.1" style="fill: #4682b4; "></rect>

Then on the page, a moveover handler could identify the "data-" attributes of any mark that is hovered over and may them back to the original data however they see fit.

Axes should have more properties

There should be a couple more attributes available for axes:

  1. A label for an axis
  2. A rotation for the tick text - especially useful when you have long tick labels.

Group Documentation

I can find examples where the 'group' mark is used and it looks it has the same structure as Visualization. But I can't find 'group' written up anywhere in the docs. Maybe I just missed it... but I suggest adding a Group section to the Marks documentation (and maybe also a note on the Visualization page that 'group' shares the same structure (if that's true).

Data transforms in non-group marks

If I add a data transform to the from definition of a non-group mark type, the mark is no longer seems able to access the data. E.g. with the bar example, adding "transform": [{"type": "stats", "value": "data.y"}] to the from definition of the rect mark results in Uncaught TypeError: Cannot read property 'x' of undefined. Similarly, with stacked_bar, moving the from definition from the group mark into its rect mark causes a similar error.

Is this intended behaviour? Can only group marks have data transforms applied to them? If so, we should update the documentation to reflect this.

Adding new ordinal values late in data raises an error

If I load "stacked_bar" in http://trifacta.github.io/vega/editor/, open the script console (in my case, Safari on Mac) and enter:

ved.view.data({table:[{x:0,y:1,c:0},{x:0,y:1,c:1},{x:0,y:1,c:2},{x:1,y:1,c:0},{x:1,y:1,c:1},{x:1,y:1,c:2}]}).update({props:'enter'}).update()

the view will update fine. However, if I remove the third element of the data and try again:

ved.view.data({table:[{x:0,y:1,c:0},{x:0,y:1,c:1},{x:1,y:1,c:0},{x:1,y:1,c:1},{x:1,y:1,c:2}]}).update({props:'enter'}).update()

then I get the error:

TypeError: 'undefined' is not an object (evaluating 'f[h][g][1]')
line: 4
message: "'undefined' is not an object (evaluating 'f[h][g][1]')"
sourceURL: "http://trifacta.github.io/vega/d3.v3.min.js"
stack: "n@http://trifacta.github.io/vega/d3.v3.min.js:4↵stack@http://trifacta.github.io/vega/vega.js:2788↵@http://trifacta.github.io/vega/vega.js:3271↵reduce@[native code]↵@http://trifacta.github.io/vega/vega.js:3271↵from@http://trifacta.github.io/vega/vega.js:3347↵build@http://trifacta.github.io/vega/vega.js:3713↵buildGroup@http://trifacta.github.io/vega/vega.js:3790↵build@http://trifacta.github.io/vega/vega.js:3723↵build@http://trifacta.github.io/vega/vega.js:4517↵update@http://trifacta.github.io/vega/vega.js:4685↵eval code↵eval@[native code]↵_evaluateOn↵↵_evaluateAndWrap↵↵evaluate↵↵[native code]"
__proto__: Error

It looks as though all of the distinct "c" values need to be defined within the first grouping of "x" values (which is the other ordinal scale).

Simplest

Would it be possible to see the simplest possible example possible?

Not sure where I'm going wrong, but I'm failing to properly initialize the visualization, and I can't make out where that happens in the current examples.

Thanks!

Recommend Projects

  • React photo React

    A declarative, efficient, and flexible JavaScript library for building user interfaces.

  • Vue.js photo Vue.js

    🖖 Vue.js is a progressive, incrementally-adoptable JavaScript framework for building UI on the web.

  • Typescript photo Typescript

    TypeScript is a superset of JavaScript that compiles to clean JavaScript output.

  • TensorFlow photo TensorFlow

    An Open Source Machine Learning Framework for Everyone

  • Django photo Django

    The Web framework for perfectionists with deadlines.

  • D3 photo D3

    Bring data to life with SVG, Canvas and HTML. 📊📈🎉

Recommend Topics

  • javascript

    JavaScript (JS) is a lightweight interpreted programming language with first-class functions.

  • web

    Some thing interesting about web. New door for the world.

  • server

    A server is a program made to process requests and deliver data to clients.

  • Machine learning

    Machine learning is a way of modeling and interpreting data that allows a piece of software to respond intelligently.

  • Game

    Some thing interesting about game, make everyone happy.

Recommend Org

  • Facebook photo Facebook

    We are working to build community through open source technology. NB: members must have two-factor auth.

  • Microsoft photo Microsoft

    Open source projects and samples from Microsoft.

  • Google photo Google

    Google ❤️ Open Source for everyone.

  • D3 photo D3

    Data-Driven Documents codes.