Git Product home page Git Product logo

rtemis's Introduction

R-CMD-check rtemis status badge

rtemis Machine Learning and Visualization

A platform for advanced Machine Learning research and applications.
The goal of rtemis is to make data science efficient and accessible with no compromise on flexibility.

Documentation

Requirements

R version 4.1 or higher

Installation

You can install rtemis from r-universe or using pak, remotes, or devtools.

  • r-universe:

    install.packages('rtemis', repos = c('https://egenn.r-universe.dev', 'https://cloud.r-project.org'))
  • pak:

    pak::pkg_install("egenn/rtemis")
  • remotes:

    remotes::install_github("egenn/rtemis")
  • devtools:

    devtools::install_github("egenn/rtemis")

Note about Fortran support in MacOS

To allow compilation from source of any dependencies that require Fortran, you will need to install the GNU Fortran compiler. The easiest way to do this is with Homebrew:

brew install gcc

Then, you will need to add the following to your ~/.R/Makevars file:

FC      = usr/local/opt/gcc/bin/gfortran
F77     = /usr/local/opt/gcc/bin/gfortran
FLIBS   = -L/usr/local/opt/gcc/lib

Note about using d_UMAP()

d_UMAP() requires the uwot package, which currently requires that the Matrix and irlba dependencies be installed from source. See more in the uwot issue here.

More setup info

See here for more setup and installation instructions.

Note: Make sure to keep your installation updated by running remotes::install_github("egenn/rtemis") regularly: it will only proceed if there are updates available.

30-second intro to rtemis

Install dependencies if they are not already installed:

packages <- c("future.apply", "ranger")
.add <- !packages %in% installed.packages()
install.packages(packages[.add])

Get cross-validated random forest performance on the iris dataset:

library(rtemis)
mod <- train_cv(iris)

What's new

We are working towards the 1.0 release, which will feature updates to the API as well as the backend, and preparing for CRAN submission. This will be accompanied by expansion of the documentation.
For all updates, please see the NEWS file.

The Python and Julia ports, rtemispy and Rtemis.jl, which are not yet publicly available, are in parallel development. With the upcoming 1.0 release of rtemis, the aim is to offer a unified API across all three languages.
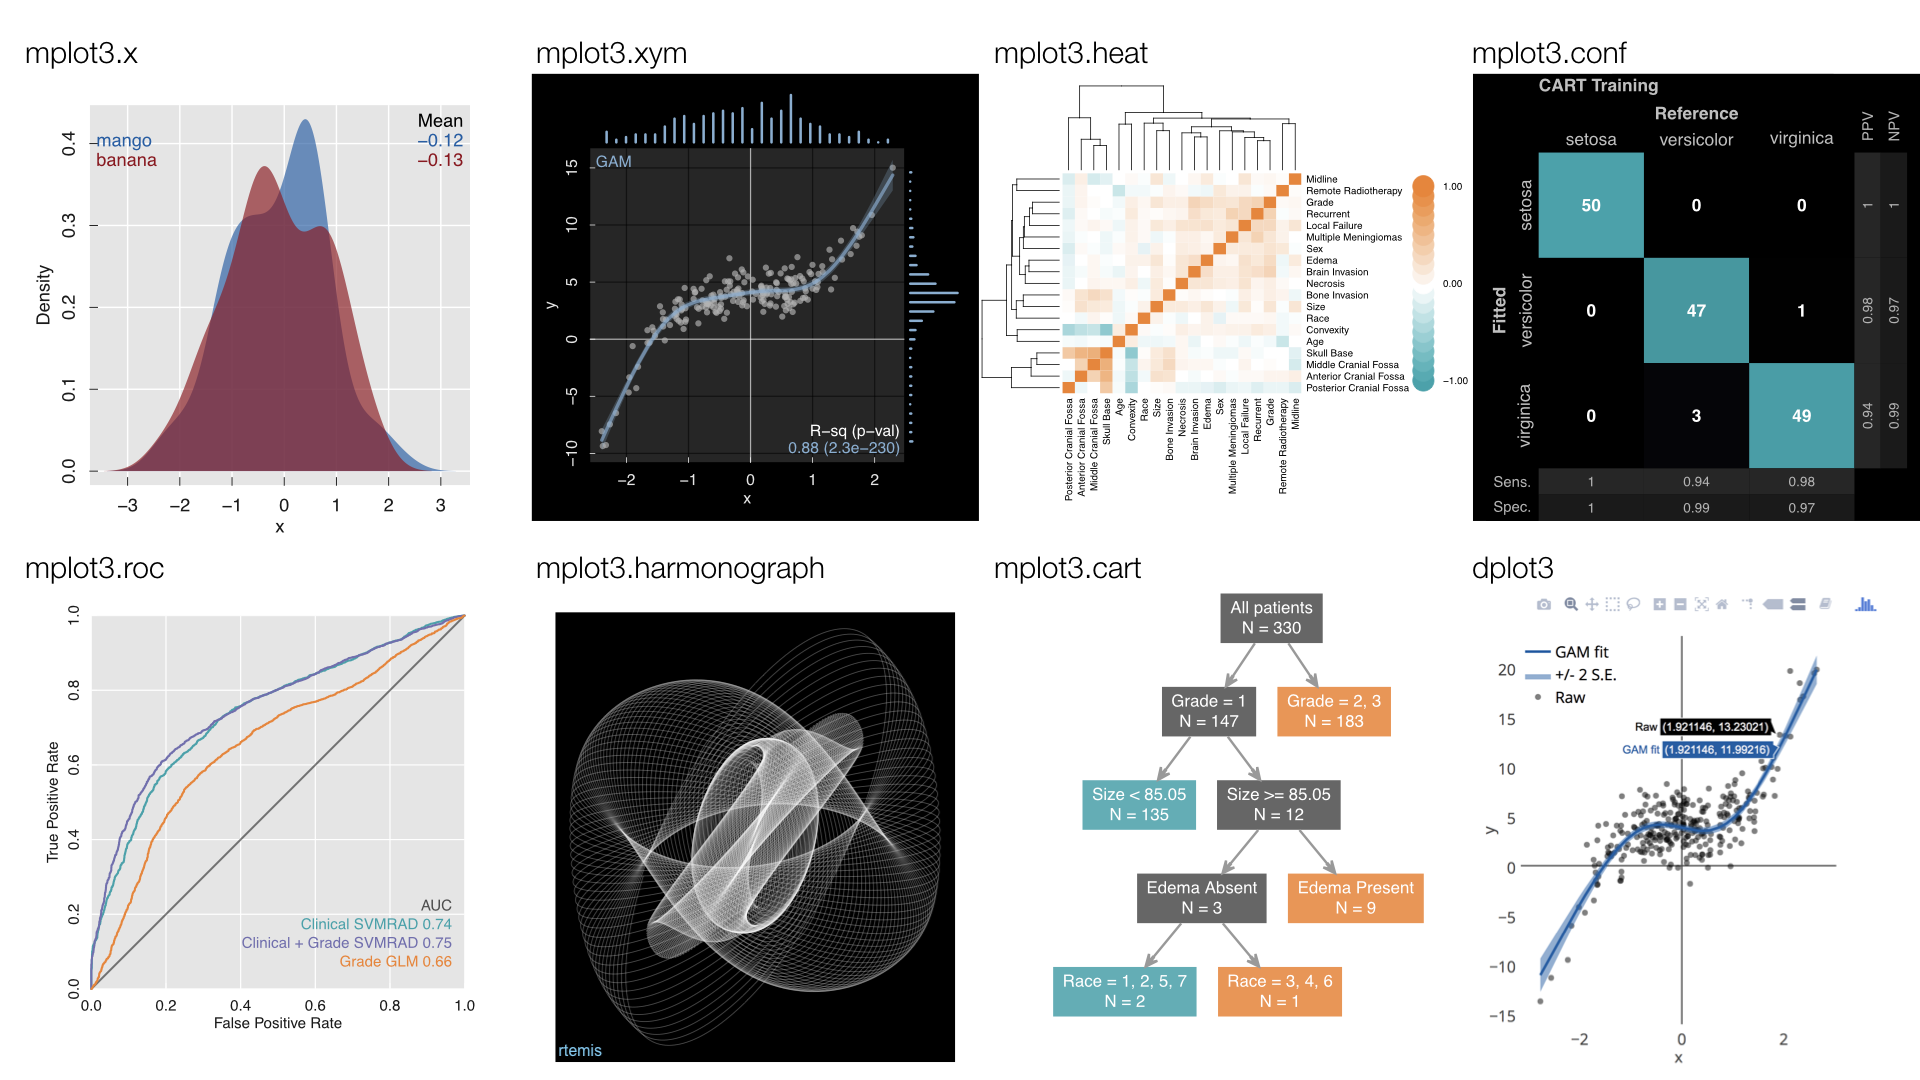
Features

  • Visualization

    • Static: mplot3 family (base graphics)
    • Dynamic: dplot3 family (plotly)
  • Unsupervised Learning

    • Clustering: c*_
    • Decomposition: d*_
  • Supervised Learning

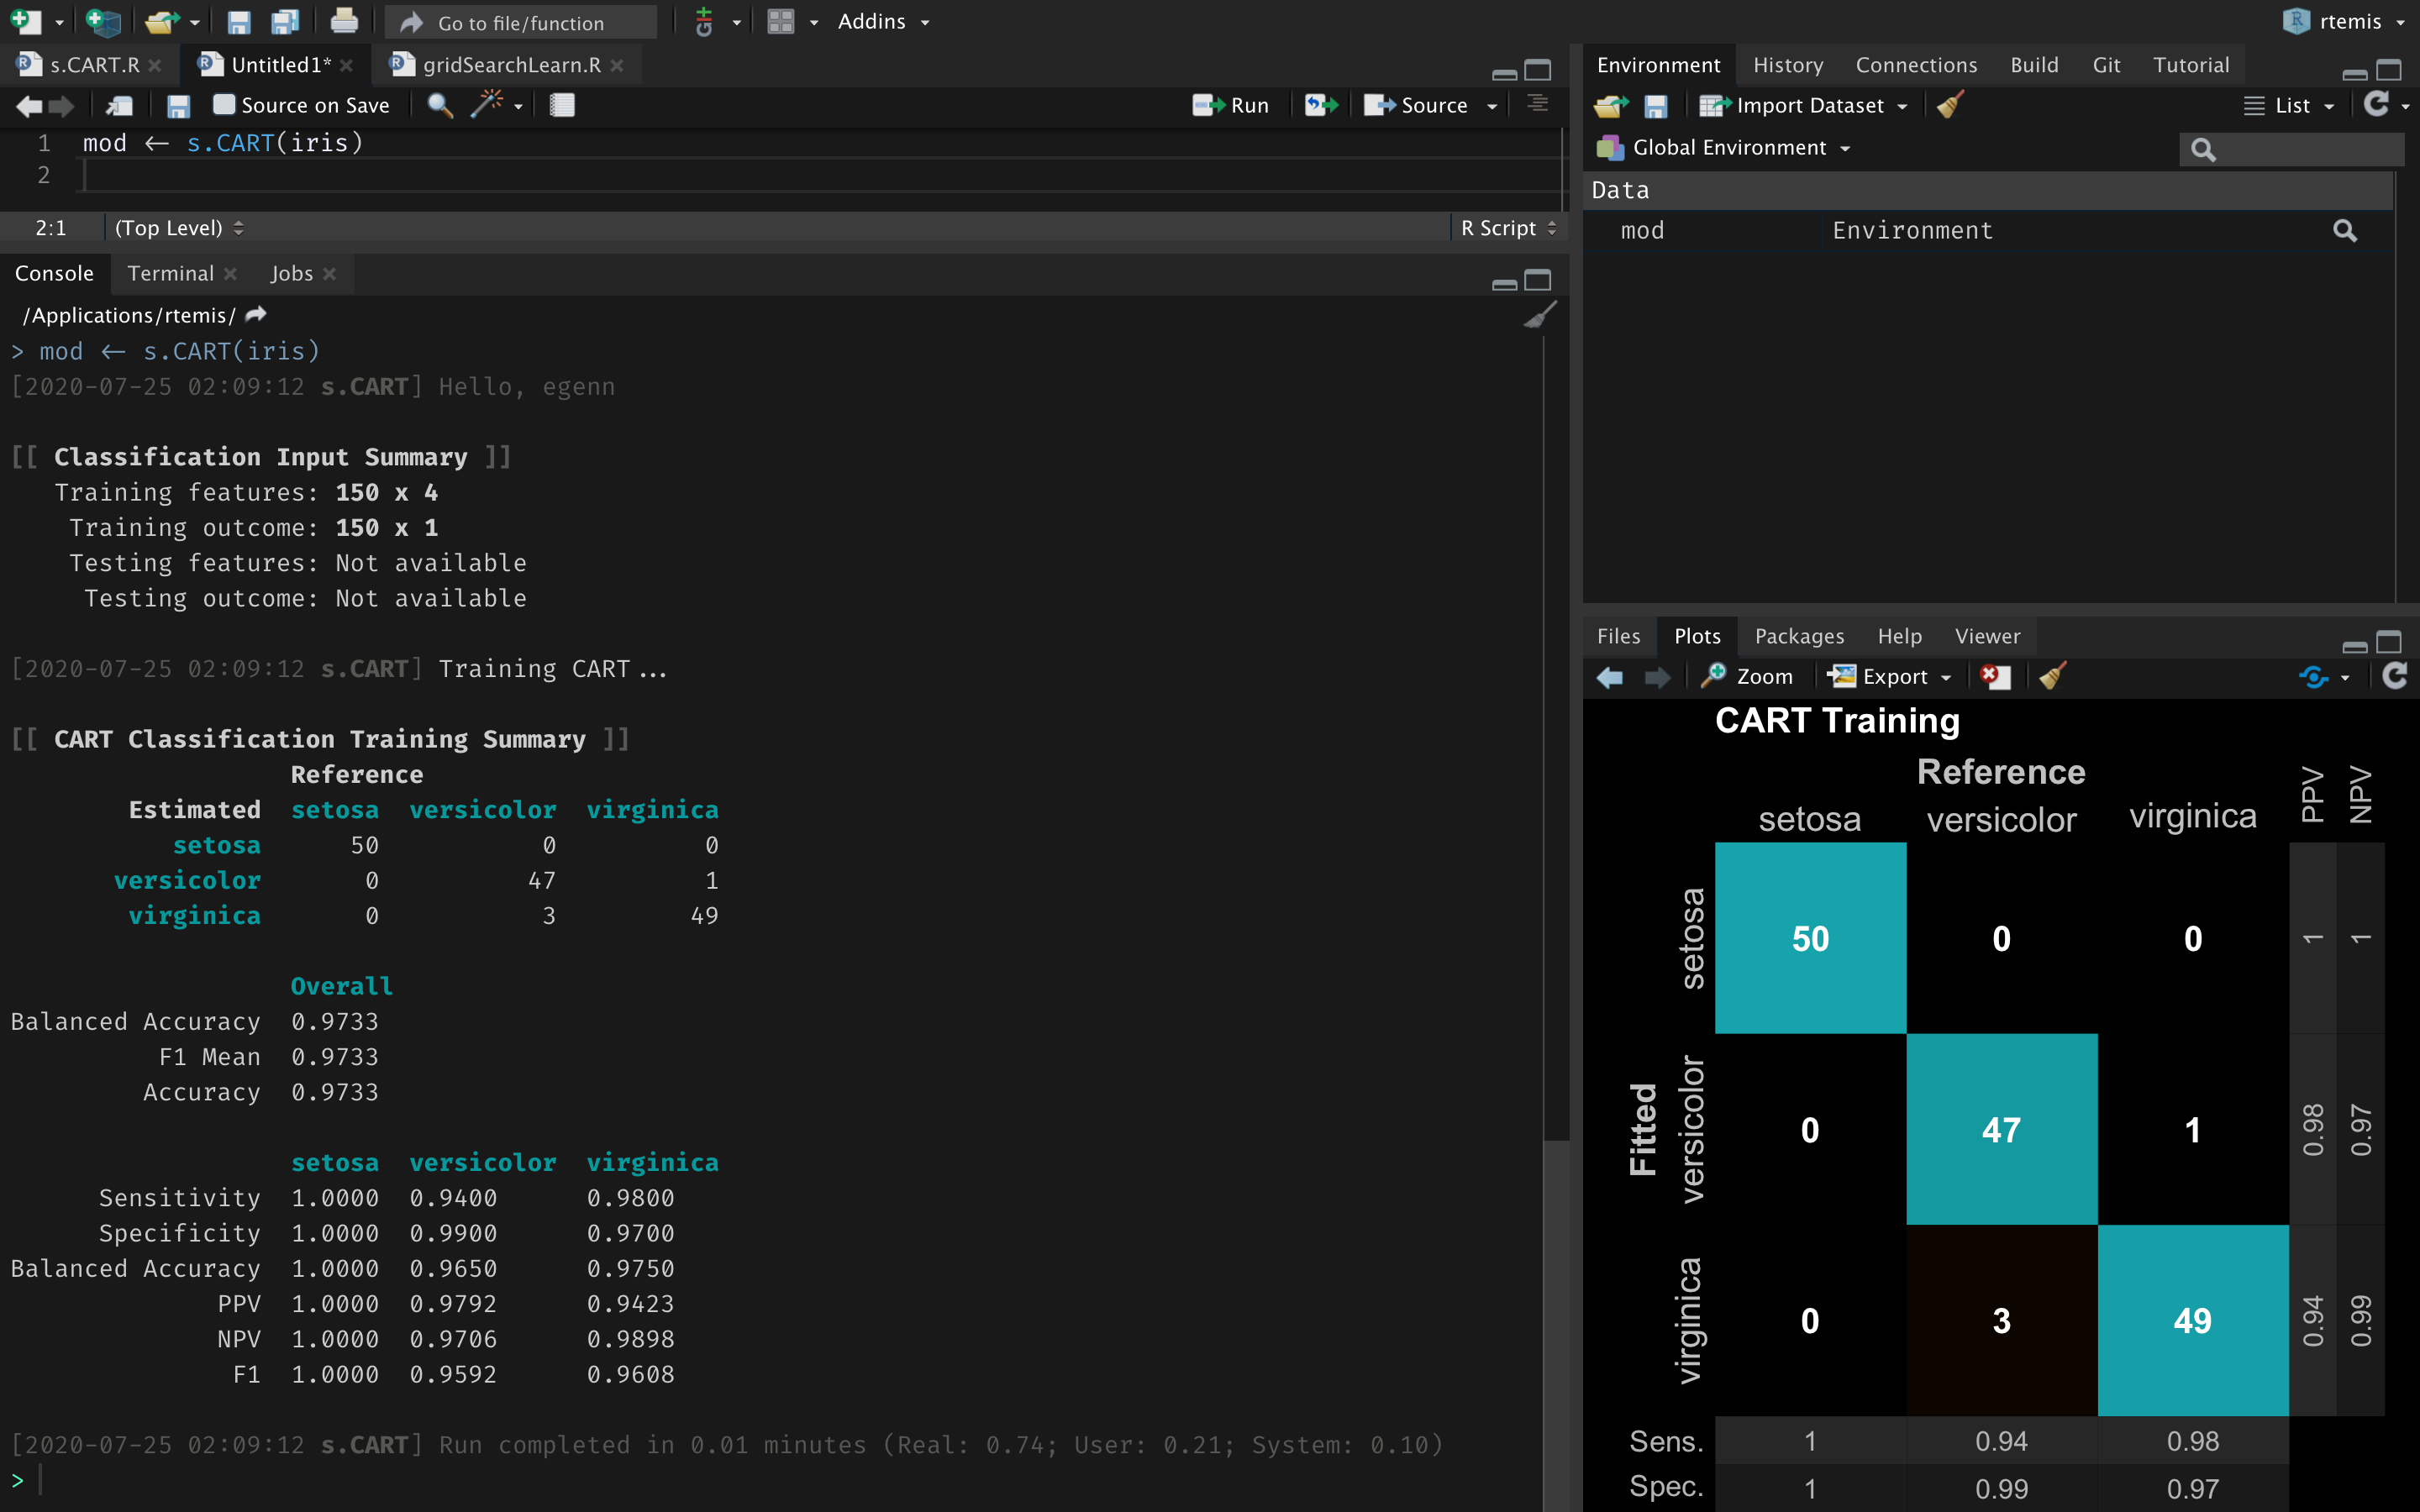
    • Classification, Regression, Survival Analysis: s*_
  • Cross-Decomposition

    • Sparse Canonical Correlation / Sparse Decomposition: x*_
  • Meta-Models

    • Model Stacking: metaMod()
    • Modality Stacking: metaFeat()
    • Group-weighted Stacking: metaGroup()

    (metaFeat and metaGroup have been removed for updating)


rtemislive

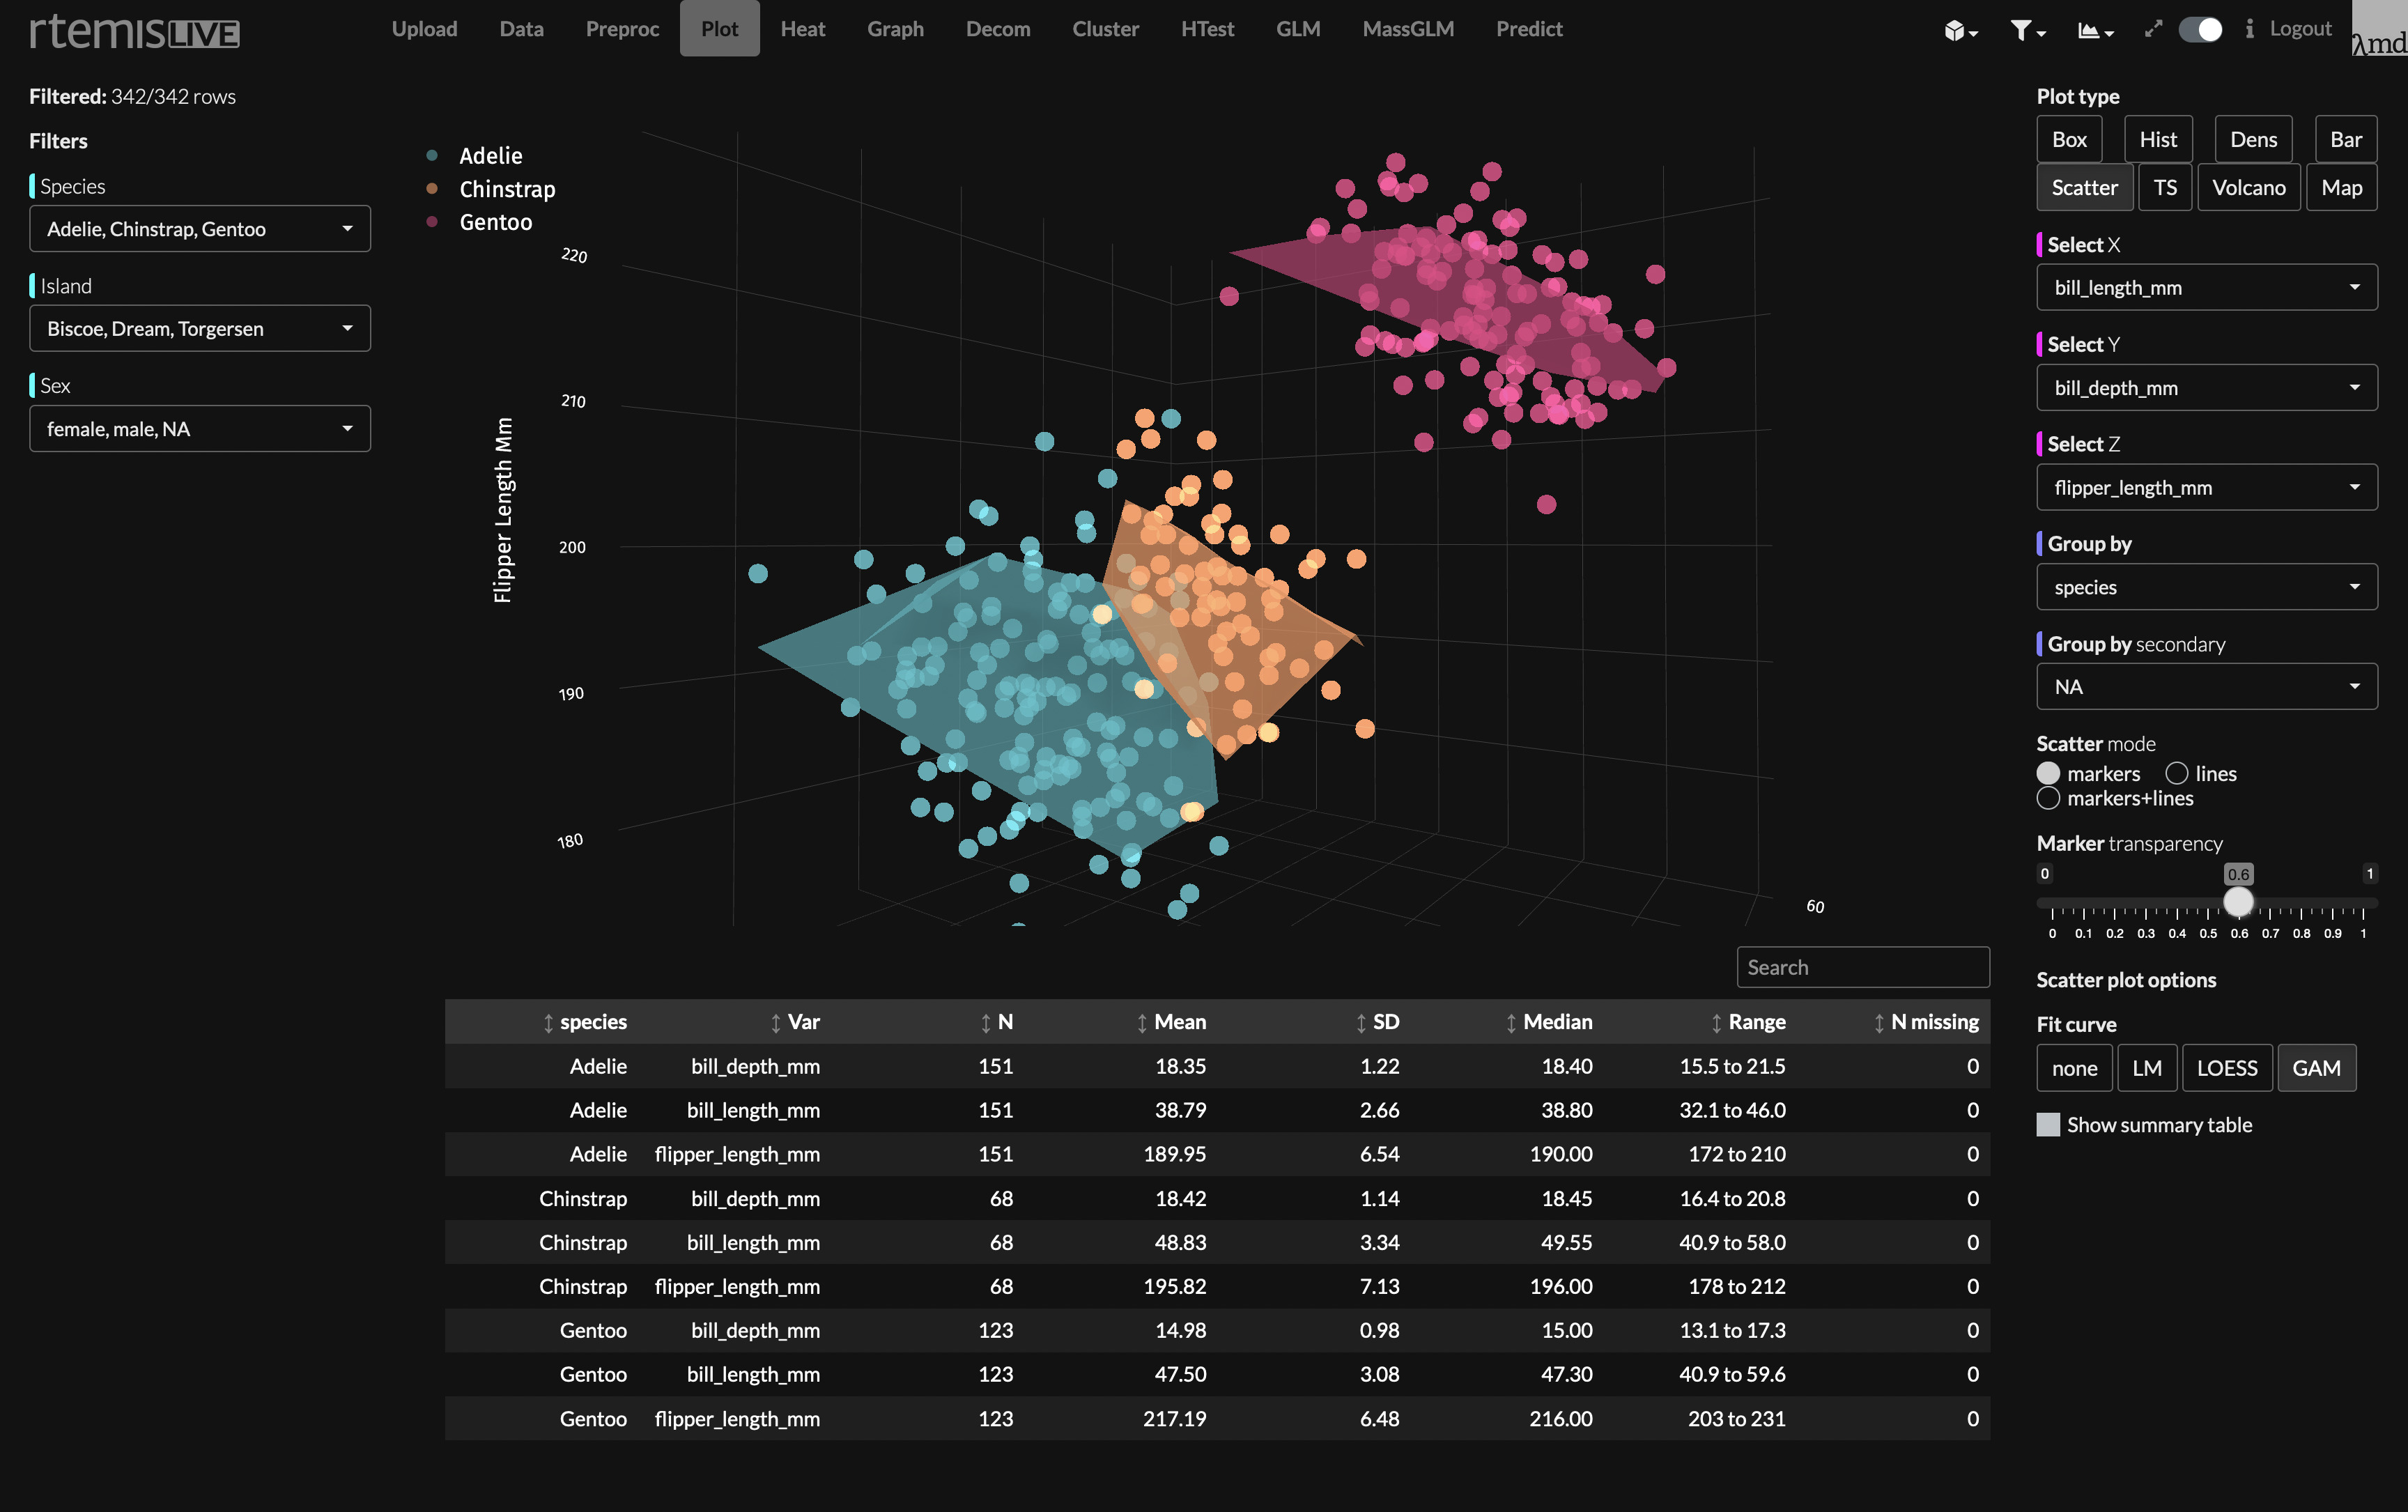
rtemislive is rtemis' web interface / GUI. It makes advanced visualization and modeling instantly accessible by all. It is currently available for beta testing at UCSF, and will be made publicly available once funding is secured for a hosting server.


VS Code theme

Get the rtemis-dark VS Code theme.

Recommended font is Fira Code with its pretty ligatures.

Python & Julia APIs

Python and Julia APIs are in development. The goal is to delliver a unified API across all three languages by the time of the 1.0 release.

rtemis's People

Contributors

egenn avatar henrikbengtsson avatar muschellij2 avatar

Stargazers

 avatar  avatar  avatar  avatar  avatar  avatar  avatar  avatar  avatar  avatar  avatar  avatar  avatar  avatar  avatar  avatar  avatar  avatar  avatar  avatar  avatar  avatar  avatar  avatar  avatar  avatar  avatar  avatar  avatar  avatar  avatar  avatar  avatar  avatar  avatar  avatar  avatar  avatar  avatar  avatar  avatar  avatar  avatar  avatar  avatar  avatar  avatar  avatar  avatar  avatar  avatar  avatar  avatar  avatar  avatar  avatar  avatar  avatar  avatar  avatar  avatar  avatar  avatar  avatar  avatar  avatar  avatar  avatar  avatar  avatar  avatar  avatar  avatar  avatar  avatar  avatar  avatar  avatar  avatar  avatar  avatar  avatar  avatar  avatar  avatar  avatar  avatar  avatar  avatar  avatar  avatar  avatar  avatar  avatar  avatar  avatar  avatar  avatar  avatar  avatar

Watchers

 avatar  avatar  avatar  avatar  avatar  avatar  avatar  avatar  avatar

rtemis's Issues

Put rtemis on R Universe

Now when we have a package that passes R CMD check, it's quite easy to put rtemis on R Universe, so it can be installed as:

install.packages("rtemis", repos = c("https://egenn.r-universe.dev", "https://cloud.r-project.org"))

To do this, see https://github.com/r-universe-org/help#how-to-setup-your-personal-universe, which boils down to:

  1. create a repository named universe, i.e. https://github.com/egenn/universe

  2. add a package.json packages.json file containing:

[
    {
        "package": "rtemis",
        "url": "https://github.com/egenn/rtemis"
    }
]
  1. Install https://github.com/apps/r-universe/installations/new to your GitHub account.

  2. Wait at most an hour.

  3. Check https://egenn.r-universe.dev.

I think this is a good first step towards submitting it to CRAN.

s_LightRuleFit error

str(Sonar)
'data.frame': 2789 obs. of 19 variables:
$ gender : num 1 1 1 2 2 2 1 2 1 2 ...
$ age : num 53 64 69 45 72 65 46 44 53 38 ...
$ WHO_pathological_type: num 3 3 3 3 3 3 3 3 2 3 ...
$ T : num 3 3 4 1 3 2 1 3 4 3 ...
$ N : num 1 1 0 1 1 2 2 1 2 0 ...
$ Stage : num 3 3 4 2 3 3 3 3 4 3 ...
$ IC : num 1 1 0 0 1 1 1 0 1 1 ...
$ IC_cycle : num 4 3 0 0 2 2 4 0 3 3 ...
$ Targeted : num 0 1 1 0 0 0 1 0 1 1 ...
$ GTV_T_f : num 200 225 200 200 212 212 212 212 212 215 ...
$ GTV_N_f : num 200 225 160 198 212 207 212 205 200 215 ...
$ residue : num 1 0 1 0 0 0 0 0 0 0 ...
$ EB_DNA_pre : num 3780 178 3670 212 110 752 427 35.5 13500 97.5 ...
$ EB_DNA_preRT : num 374 0 97.9 212 43.1 160 0 35.5 0 0 ...
$ EB_DNA_afterRT : num 148 47.7 0 0 21 0 0 0 0 0 ...
$ CC : num 0 0 0 1 0 1 1 1 1 0 ...
$ AC_real : num 0 0 0 0 0 1 0 0 0 0 ...
$ S1 : num 0 0 0 0 0 0 0 0 0 0 ...
$ Class : Factor w/ 3 levels "ER","LR","NR": 3 1 3 3 3 3 3 3 3 2 ...

数据重采样分组

res <- resample(Sonar,seed = 2024,train.p = 0.75)
06-30-24 21:37:54 Input contains more than one columns; will stratify on last [resample]
.:Resampling Parameters
n.resamples: 10
resampler: strat.sub
stratify.var: y
train.p: 0.75
strat.n.bins: 4
06-30-24 21:37:54 Using max n bins possible = 3 [strat.sub]
06-30-24 21:37:54 Created 10 stratified subsamples [resample]
sonar.train <- Sonar[res$Subsample_1, ]
sonar.test <- Sonar[-res$Subsample_1, ]

s_LightRuleFit

mod.LightRuleFit <- s_LightRuleFit(sonar.train, sonar.test,

  •                                n.cores = 20)
    

06-30-24 21:38:03 Hello, huangzongwei [s_LightRuleFit]
06-30-24 21:38:03 Running LightGBM... [s_LightRuleFit]
06-30-24 21:38:03 Hello, huangzongwei [s_LightGBM]

06-30-24 21:38:03 Imbalanced classes: using Inverse Frequency Weighting [prepare_data]

.:Classification Input Summary
Training features: 2091 x 18
Training outcome: 2091 x 1
Testing features: Not available
Testing outcome: Not available

06-30-24 21:38:03 Training LightGBM Classification... [s_LightGBM]

.:LightGBM Classification Training Summary
Reference
Estimated ER LR NR
ER 110 0 148
LR 1 99 159
NR 1 0 1573

               Overall  

Balanced Accuracy 0.9396
F1 Mean 0.6862
Accuracy 0.8522

               ER      LR      NR      
  Sensitivity  0.9821  1.0000  0.8367
  Specificity  0.9252  0.9197  0.9953

Balanced Accuracy 0.9537 0.9598 0.9160
PPV 0.4264 0.3822 0.9994
NPV 0.9989 1.0000 0.4062
F1 0.5946 0.5531 0.9108
06-30-24 21:39:47 Estimating LightGBM variable importance... [s_LightGBM]
06-30-24 21:39:52 Completed in 1.81 minutes (Real: 108.62; User: 1002.20; System: 6.18) [s_LightGBM]
06-30-24 21:39:52 Extracting LightGBM rules... ✓ [s_LightRuleFit]
06-30-24 21:39:52 Extracted 674 rules. [s_LightRuleFit]
06-30-24 21:39:52 Matching 674 rules to 2091 cases... ✓ [matchCasesByRules]
06-30-24 21:39:52 Running LASSO on GBM rules... [s_LightRuleFit]
06-30-24 21:39:52 Hello, huangzongwei

06-30-24 21:39:52 Imbalanced classes: using Inverse Frequency Weighting [prepare_data]

.:Classification Input Summary
Training features: 2091 x 674
Training outcome: 2091 x 1
Testing features: Not available
Testing outcome: Not available

06-30-24 21:39:53 Running grid search... [gridSearchLearn]
.:Resampling Parameters
n.resamples: 5
resampler: kfold
stratify.var: y
strat.n.bins: 4
06-30-24 21:39:53 Using max n bins possible = 3 [kfold]
06-30-24 21:39:53 Created 5 independent folds [resample]
.:Search parameters
grid.params:
alpha: 1
fixed.params:
.gs: TRUE
which.cv.lambda: lambda.1se
06-30-24 21:39:53 Tuning Elastic Net by exhaustive grid search. [gridSearchLearn]
06-30-24 21:39:53 5 inner resamples; 5 models total; running on 20 workers (x86_64-pc-linux-gnu) [gridSearchLearn]
06-30-24 21:45:37 Extracting best lambda from GLMNET models... [gridSearchLearn]
.:Best parameters to maximize Balanced Accuracy
best.tune:
lambda: 0.0474918942741433
alpha: 1
06-30-24 21:45:37 Completed in 5.74 minutes (Real: 344.36; User: 334.39; System: 3.34) [gridSearchLearn]

.:Parameters
alpha: 1
lambda: 0.0474918942741433

06-30-24 21:45:37 Training elastic net model...

.:GLMNET Classification Training Summary
Reference
Estimated ER LR NR
ER 84 13 459
LR 14 68 344
NR 14 18 1077

               Overall  

Balanced Accuracy 0.6699
F1 Mean 0.4104
Accuracy 0.5878

               ER      LR      NR      
  Sensitivity  0.7500  0.6869  0.5729
  Specificity  0.7615  0.8203  0.8483

Balanced Accuracy 0.7557 0.7536 0.7106
PPV 0.1511 0.1596 0.9711
NPV 0.9818 0.9814 0.1823
F1 0.2515 0.2590 0.7206
06-30-24 21:45:37 Completed in 5.75 minutes (Real: 345.01; User: 334.91; System: 3.46)
Error in as.data.frame.default(x[[i]], optional = TRUE) :
cannot coerce class ‘structure("dgCMatrix", package = "Matrix")’ to a data.frame

trouble with downloading rtemis

Hi there
I am having trouble with downloading the package. I did try to troubleshoot using available sites and comments/solutions discussed by other users but still am unable to download. the message is error shown below:

  • installing source package 'rtemis' ...
    ** using staged installation
    ** R
    Error in parse(outFile) :
    C:/Users/...../AppData/Local/Temp/RtmpG2toXY/R.INSTALL9e6022be7db0/rtemis/R/dplot3.bar.R:209:16: unexpected '>'
    208: for (i in seq(ncol(dat))) {
    209: plt |>
    ^
    ERROR: unable to collate and parse R files for package 'rtemis'
  • removing 'C:/Users/....../Documents/R/R-4.0.3/library/rtemis'

thank you kindly

Variable Importance on AddTree

Hi, I have read through the documentation and vignettes but couldn't find a way to estimate varImp for addTree. What is the best way to do this?

Thanks!

Lots of missing no visible global function/no visible binding for global variable

R CMD check --as-cran reports:

❯ checking R code for possible problems ... [34s/34s] NOTE
  binmat2vec: no visible global function definition for ‘.’
  dplot3_addtree: no visible binding for global variable ‘plt’
  dplot3_box: no visible binding for global variable ‘ID’
  dplot3_box: no visible global function definition for ‘.’
  dplot3_box: no visible binding for global variable ‘timeperiod’
  dt_describe: no visible binding for global variable ‘..index_nm’
  dt_describe: no visible binding for global variable ‘..index_cf’
  dt_describe: no visible binding for global variable ‘..index_dt’
  dt_get_duplicates: no visible binding for global variable ‘..on’
  dt_get_factor_levels: no visible binding for global variable
    ‘..factor_index’
  glm2table: no visible binding for global variable ‘..i’
  gplot3_map: no visible binding for global variable ‘x’
  gplot3_map: no visible binding for global variable ‘y’
  gplot3_map: no visible binding for global variable ‘group’
  gplot3_map: no visible binding for global variable ‘county’
  gplot3_map: no visible binding for global variable ‘abbr’
  likelihoodMediboostChooseFeat: no visible binding for global variable
    ‘rpart.params’
  matchCasesByRules: no visible binding for global variable ‘ID’
  mplot3_conf: no visible binding for global variable ‘autolabel’
  mplot3_heatmap: no visible binding for global variable ‘autolabel’
  mplot3_laterality: no visible binding for global variable ‘..index’
  mplot3_mosaic: no visible binding for global variable ‘autolabel’
  mplot3_varimp: no visible binding for global variable ‘autolabel’
  mplot_AGGTEobj: no visible binding for global variable ‘font.family’
  plotly_shade: no visible binding for global variable ‘scatter.type’
  preprocess_: no visible binding for global variable ‘..exclude’
  s_HAL: no visible binding for global variable ‘which.cv.lambda’
  s_LMTree: no visible binding for global variable ‘varimp’
  s_LightRuleFit: no visible binding for global variable ‘Empirical_Risk’
  s_LightRuleFit: no visible binding for global variable ‘Coefficient’
  s_PolyMARS: no visible binding for global variable ‘s_POLYMARS’
  s_RuleFit: no visible binding for global variable ‘s_RULEFIT’
  splitlin_: no visible binding for global variable ‘rtOrange’
  splitlineRC: no visible binding for global variable ‘rho.def’
  summarize.data.table: no visible global function definition for ‘.’
  varSelect: no visible binding for global variable ‘s_XGBLIN’
  Undefined global functions or variables:
    . ..exclude ..factor_index ..i ..index ..index_cf ..index_dt
    ..index_nm ..on Coefficient Empirical_Risk ID abbr autolabel county
    font.family group plt rho.def rpart.params rtOrange s_POLYMARS
    s_RULEFIT s_XGBLIN scatter.type timeperiod varimp which.cv.lambda x y

Some of them might be bugs, i.e. non-existing functions or objects. Others might be used in NSE code. For the latter, I use dummy assignments to NULL at the top of the function, e.g.

foo <- function(x) {
  ## To please R CMD check
  abc <- def <- NULL

  my_nse(x, abc & def)
}

Others use:

utils::globalVariables(c("abc", "def"))

foo <- function(x) {
  my_nse(x, abc & def)
}

but I think that's too blunt and error-prone.

Missing or unexported object: ‘polars::csv_reader’

❯ checking dependencies in R code ... WARNING
  Missing or unexported object: ‘polars::csv_reader’
$ grep -F polars::csv_reader R/*.R
R/read.R:#'   `polars::csv_reader()`
R/read.R:#' should match columns. See `?polars::csv_reader` for more details.
R/read.R:      .dat <- polars::csv_reader(

dplot3.addtree: Error: syntax error in line 13 near '"'

Playing around with the package a bit and after creating an AddTree, the visualization won't work:

df.tree <- s.ADDTREE(df, gamma = 5, learning.rate = 0.1, upsample = TRUE)
dplot3.addtree(df.tree)

Results in the following error in the plot window (not the console)

Error: syntax error in line 13 near '"'

As a side note, I don't necessarily need to visualize the model using an interactive HTML graph. Are there any other tree visualization functions that can be used for AddTrees?

Suggestion: Drop LICENSE file

Unless LICENSE file contains additional GPL (>= 3) compatible additions, it can be dropped, because it's sufficient to specify:

License: GPL (>= 3)

in the DESCRIPTION file in R package. This is what all packages on CRAN do. I think CRAN actually asks for it to be removed, and currently R CMD check --as-cran dumps all of the content as NOTE.

tibble / data.table friendliness

First off -- this is one of the most incredible packages I have ever seen. I cannot thank you enough for your hard work on this package, what you have built is nothing short of remarkable.

One thing that could be super beneficial as more and more people find out about rtemis is making sure it can jive with tibble/data.table inputs. I have seen that it will sometimes work ok with tibbles but in other cases it appears to break. This may also help you speed up the package, I have to think that people from the tidyverse and data.table communities maybe to help with this.

preprocess impute missing cases: Error when using missRanger

When using the preprocess command with impute = TRUE and otherwise default values (i.e. impute.type ="missRanger"), the following error occurs:

Error in `[.data.frame`(data, , relevantVars[[1]], drop = FALSE) : undefined columns selected`

The error does not appear when using missForest

polars: can it be moved to your "rtemis-extra" package?

The polars package:

Because of this, the dependency on polars:

  • complicates checking the package with all R dependencies including those under Suggests:
  • the alternative is to set _R_CHECK_SUGGESTS_ONLY_=false when testing
  • complicates checking on GitHub Actions
  • makes it harder to submit to CRAN, because they check with _R_CHECK_SUGGESTS_ONLY_=true

My suggestion is to remove polars as a dependency on rtemis. If it can be incorporated via that other package where you moved other dependencies (rtemis-extra?), that would be much better.

If polars is removed, then it should be straightforward to set up package checks via GitHub Actions.

resampler != "loocv"

Not thinking, I updated my installation today, which has resulted in the following error in previously working code. I'm using elevate() to run RANGER, GBM, and so on.

Error in if (resampler != "loocv") { : argument is of length zero

Tomorrow, I'll try to reproduce the error by running tutorial examples. Posting now in the event there is a quick solution.

HELP: Missing link or links in documentation object 'gam2table.Rd'

R CMD check --as-cran reports:

❯ checking Rd cross-references ... WARNING
  Missing link or links in documentation object 'gam2table.Rd':
    ‘gam’
  
  See section 'Cross-references' in the 'Writing R Extensions' manual.

from

$ grep -F gam man/gam2table.Rd
\name{gam2table}
\alias{gam2table}
gam2table(mods, modnames = NULL)
\item{x}{list of \link{gam} models}

`mplot3.xy` does not respect `ylim` when adding `fit`

example below builds on the documentation code.

this:

  mplot3.xy(x, list(squared = ysq, cubed = ycu), fit = "gam",ylim=c(-20,20))

versus

  mplot3.xy(x, list(squared = ysq, cubed = ycu), ylim=c(-20,20))

would expect limits to be -20, 20 in both cases. not sure if this is intended behavior.

based on remotes install this AM.

Looks like Decom Broke

rtemis::decom(x = mtcars, decom = "pca")

Error in if (!is.na(caller)) { : argument is of length zero)

Trying to predict with a bag model produces NA

I am trying to use the result of a bag model fit to predict on new data. When I use predict I am getting NAs as the predicted value. Here's a reproducible example:

parkinsons <- read.csv("https://archive.ics.uci.edu/ml/machine-learning-databases/parkinsons/parkinsons.data")

parkinsons$Status <- factor(parkinsons$status, levels = c(1, 0))
parkinsons$status <- NULL
parkinsons$name <- NULL

res <- resample(parkinsons, seed = 2019)
park.train <- parkinsons[res$Subsample_1, ]
park.test <- parkinsons[-res$Subsample_1, ]

test_bag <- bag(park.train, 
                park.test, 
                mod = 'cart', 
                k = 10, 
                mod.params = list(maxdepth = 1), 
                .resample = rtset.resample(resampler = 'bootstrap', 
                                           n.resamples = 20))

predict(test_bag, park.test)

   1    6   13   14   18   29   31   32   37   38   42   44   49   53   54   56   57   58   61 
<NA> <NA> <NA> <NA> <NA> <NA> <NA> <NA> <NA> <NA> <NA> <NA> <NA> <NA> <NA> <NA> <NA> <NA> <NA> 
  63   72   77   80   81   83   88   92   95  101  103  104  106  119  122  126  127  131  135 
<NA> <NA> <NA> <NA> <NA> <NA> <NA> <NA> <NA> <NA> <NA> <NA> <NA> <NA> <NA> <NA> <NA> <NA> <NA> 
 142  148  149  150  154  163  168  176  182  190  195 
<NA> <NA> <NA> <NA> <NA> <NA> <NA> <NA> <NA> <NA> <NA> 
Levels: 1 0

I see the same behavior on other data.

Linear Model Wrapper not Ported

Stathis,

Looks like LM and a couple of other functions aren't ported to the new s_ API {looks like s.GLS, s.H20GBM, s.H20RF, s.IRF, s.KNN, s.LDA, s.LOESS, s.NBAYES, s.RLM} are not yet ported and break using rtemis::learn.

Thanks for the amazing work!

gam2table(): should it be exported?

R CMD check reports on:

  Undocumented arguments in documentation object 'gam2table'
    ‘mods’ ‘modnames’
  Documented arguments not in \usage in documentation object 'gam2table':
    ‘x’ ‘xnames’ ‘include_anova_pvals’

While looking at this, I noticed that rtemis:::gam2table() is documented by not exported;

rtemis/R/glm2table.R

Lines 1 to 20 in 31cd8eb

# glm2table.R
# ::rtemis::
# 2021 E.D. Gennatas www.lambdamd.org
#' Collect summary table from list of massGLMs with same predictors, different outcome
#' ("massy")
#'
#' @param x list of [glm] models
#' @param xnames Character, vector: names of models
#' @param include_anova_pvals Integer: 1 or 3; to output ANOVA I or III p-vals. NA to not
#' @param warn Logical: If TRUE, warn when values < than machine eps are replaced by
#' machine eps
#'
#' @return `data.table` with glm summaries
#' @author E.D. Gennatas
glm2table <- function(x,
xnames = NULL,
include_anova_pvals = NA,
warn = TRUE) {

Should it be exported?

FWIW, it looks like R CMD check picks up another gam2table from one of the dependencies.

Could you fix dependencies?

mod <- elevate(iris)
[2019-05-15 20:35:47 elevate] Hello, turgut
[2019-05-15 20:35:48 depCheck] Dependencies missing:
     pbapply

Error in elevate(iris) : Please install dependencies and try again
epCheck] Dependencies missing:
     ranger

Error in s.RANGER(x = list(Sepal.Length = c(4.7, 4.6, 5, 5.4, 5, 4.4,  : 
  Please install dependencies and try again

s.ADDTREE couldn't finish when argument prune is set to FALSE

Hi, I have identified a potential bug when tuning additive tree with argument "prune" is set to FALSE. The process stopped after running for a while with the console showing the sign "?". Any attempt to respond to this, i.e. by providing TRUE or FALSE, will cause the R session to encounter a fatal error.

MissRanger Error

Dear, I want to impute a dataframe with only binary values (0 -1 ) or integer or double values.
The imputed columns have names reported below.
when I run missRanger I get the error :

Error in [.data.frame(data, , relevantVars[[1]], drop = FALSE): undefined columns selected

traceback:
eval(parse(text = code), envir = envir)
train_impute_missRanger(train_vars_cleaned = train_vars_cleaned)
missRanger(only_data, pmm.k = num.k, num.trees = ntree, max.depth = max.depth, splitrule = splitrule, sample.fraction = sample.fraction)
vapply(data[, relevantVars[[1]], drop = FALSE], FUN.VALUE = TRUE, function(z) anyNA(z) && !all(is.na(z)))
data[, relevantVars[[1]], drop = FALSE]
[.data.frame(data, , relevantVars[[1]], drop = FALSE)
stop("undefined columns selected")

Is this because the column names contain numbers?

[1] "age"
[2] "hp_0000020-urinary_incontinence"
[3] "hp_0000458-anosmia"
[4] "hp_0000572-visual_loss"
[5] "hp_0000716-depressivity"
[6] "hp_0000739-anxiety"
[7] "hp_0000988-skin_rash"
[8] "hp_0001289-confusion"
[9] "hp_0001324-muscle_weakness"
[10] "hp_0001596-alopecia"
[11] "hp_0001742-nasal_obstruction"
[12] "hp_0001888-lymphopenia"
[13] "hp_0001945-fever"
[14] "hp_0001962-palpitations"
[15] "hp_0002013-vomiting"
[16] "hp_0002014-diarrhea"
[17] "hp_0002015-dysphagia"
[18] "hp_0002018-nausea"
[19] "hp_0002027-abdominal_pain"
[20] "hp_0002039-anorexia"
[21] "hp_0002091-restrictive_ventilatory_defect"
[22] "hp_0002094-dyspnea"
[23] "hp_0002110-bronchiectasis"
[24] "hp_0002315-headache"
[25] "hp_0002321-vertigo"
[26] "hp_0002354-memory_impairment"
[27] "hp_0002355-difficulty_walking"
[28] "hp_0002360-sleep_disturbance"
[29] "hp_0002607-bowel_incontinence"
[30] "hp_0002829-arthralgia"
[31] "hp_0003326-myalgia"
[32] "hp_0003546-exercise_intolerance"
[33] "hp_0004396-poor_appetite"
[34] "hp_0006530-abnormal_pulmonary_interstitial_morphology"
[35] "hp_0009710-chilblains"
[36] "hp_0011134-low-grade_fever"
[37] "hp_0011227-elevated_c-reactive_protein_level"
[38] "hp_0012378-fatigue"
[39] "hp_0012384-rhinitis"
[40] "hp_0012531-pain"
[41] "hp_0012735-cough"
[42] "hp_0025095-sneeze"
[43] "hp_0025179-ground-glass_opacification_on_pulmonary_hrct"
[44] "hp_0025337-red_eye"
[45] "hp_0025390-reticular_pattern_on_pulmonary_hrct"
[46] "hp_0025435-increased_lactate_dehydrogenase_level"
[47] "hp_0030766-ear_pain"
[48] "hp_0030879-interlobular_septal_thickening_on_pulmonary_hrct"
[49] "hp_0031245-productive_cough"
[50] "hp_0031246-nonproductive_cough"
[51] "hp_0031249-parageusia"
[52] "hp_0031284-flushing"
[53] "hp_0031352-chest_tightness"
[54] "hp_0031417-rhinorrhea"
[55] "hp_0031987-diminished_ability_to_concentrate"
[56] "hp_0032177-parenchymal_consolidation"
[57] "hp_0033047-body_ache"
[58] "hp_0033050-pharyngalgia"
[59] "hp_0041051-ageusia"
[60] "hp_0100749-chest_pain"
[61] "hp_0100785-insomnia"
[62] "hp_bc_0003401_paresthesia"
[63] "hpo_0003401-paresthesia"
[64] "hpo_0025143-chills"
[65] "no_hpo"
[66] "cancer_mass"
[67] "asthma"
[68] "epilepsy"
[69] "asperger"
[70] "autism"
[71] "behavioural_disorder"
[72] "attention_language_disorder"
[73] "obesity"
[74] "leukemia"
[75] "transplanted"
[76] "respiratory_lung_problem"
[77] "renal_problem"
[78] "acute_syndrome"
[79] "cardiovascular"
[80] "no_conditions"
[81] "drug_529118"
[82] "drug_705944"
[83] "drug_753626"
[84] "drug_922802"
[85] "drug_951511"
[86] "drug_967823"
[87] "drug_975125"
[88] "drug_989878"
[89] "drug_1000560"
[90] "drug_1107882"
[91] "drug_1125315"
[92] "drug_1127433"
[93] "drug_1146773"
[94] "drug_1146774"
[95] "drug_1146775"
[96] "drug_1146788"
[97] "drug_1146789"
[98] "drug_1154029"
[99] "drug_1154195"
[100] "drug_1154343"
[101] "drug_1154615"
[102] "drug_1154619"
[103] "drug_1177480"
[104] "drug_1511246"
[105] "drug_1518254"
[106] "drug_1518292"
[107] "drug_1518606"
[108] "drug_1549786"
[109] "drug_1551170"
[110] "drug_1560524"
[111] "drug_1593185"
[112] "drug_1593349"
[113] "drug_1705674"
[114] "drug_1713332"
[115] "drug_1713370"
[116] "drug_1713479"
[117] "drug_1734108"
[118] "drug_1759842"
[119] "drug_1760056"
[120] "drug_1796475"
[121] "drug_2718651"
[122] "drug_19005965"
[123] "drug_19005968"
[124] "drug_19008723"
[125] "drug_19019050"
[126] "drug_19019072"
[127] "drug_19019073"
[128] "drug_19020053"
[129] "drug_19023564"
[130] "drug_19070310"
[131] "drug_19070869"
[132] "drug_19072159"
[133] "drug_19072176"
[134] "drug_19073186"
[135] "drug_19073187"
[136] "drug_19073189"
[137] "drug_19073777"
[138] "drug_19075033"
[139] "drug_19075034"
[140] "drug_19076953"
[141] "drug_19077463"
[142] "drug_19078461"
[143] "drug_19079160"
[144] "drug_19079524"
[145] "drug_19112656"
[146] "drug_19115197"
[147] "drug_19123359"
[148] "drug_19123989"
[149] "drug_19128020"
[150] "drug_19131109"
[151] "drug_19135374"
[152] "drug_35603428"
[153] "drug_35605480"
[154] "drug_35605482"
[155] "drug_36249701"
[156] "drug_36250141"
[157] "drug_40167259"
[158] "drug_40168116"
[159] "drug_40169217"
[160] "drug_40213146"
[161] "drug_40213178"
[162] "drug_40213198"
[163] "drug_40213217"
[164] "drug_40213230"
[165] "drug_40213251"
[166] "drug_40213286"
[167] "drug_40213288"
[168] "drug_40213299"
[169] "drug_40213304"
[170] "drug_40213322"
[171] "drug_40220357"
[172] "drug_40221381"
[173] "drug_40227012"
[174] "drug_40228087"
[175] "drug_40228203"
[176] "drug_40228214"
[177] "drug_40232435"
[178] "drug_40232756"
[179] "drug_40233964"
[180] "drug_40241046"
[181] "drug_40241504"
[182] "drug_42707627"
[183] "drug_42901928"
[184] "drug_46287338"
[185] "no_drugs"
[186] "count_missing"
[187] "gender_male"
[188] "ethnicity_Hispanic_or_latino"
[189] "race_white"
[190] "race_black"
[191] "race_asian"
[192] "race_islander"
[193] "wt"

shap value

Can you add shap value function? At present, the data generated by rtemis cannot be analyzed by shapviz.

Rulefit memory issue

I have a HP Elitebook with Intel Core i7, 32 Gb RAM running with Windows10. When trying to run RuleFit on 80000 cases with 20 variables I got a message like: unable to allocate a vector of 7 Gb size. Is there a way to work with data set of similar size or greater?

Error installation package

Hello @egenn,

I cannot install the package. It seems related to your latest commit.

I send you below the error message:

* installing *source* package ‘rtemis’ ...
** using staged installation
** R
Error in parse(outFile) : 
  /tmp/RtmpJTUnXV/R.INSTALL315c7458aaa42/rtemis/R/glm2table.R:26:34: unexpected input
25:              do.call(rbind,
26:                      c(lapply(x, \
                                     ^

Thank you very much!

plotVarImp() fails with missing value error in if (bipolar)

Hey! Apologies for submitting so many issues. When I train an AddTree on the cases_test dataset and try to plot variable importance, it fails.

Example:

cases_test.tree <- read_csv("cases_test.csv") %>% 
  preprocess(numeric2factor = TRUE) %>% 
  s.ADDTREE()

cases_test.tree$plotVarImp()

fails with:

Error in if (bipolar) { : missing value where TRUE/FALSE needed

Recommend Projects

  • React photo React

    A declarative, efficient, and flexible JavaScript library for building user interfaces.

  • Vue.js photo Vue.js

    🖖 Vue.js is a progressive, incrementally-adoptable JavaScript framework for building UI on the web.

  • Typescript photo Typescript

    TypeScript is a superset of JavaScript that compiles to clean JavaScript output.

  • TensorFlow photo TensorFlow

    An Open Source Machine Learning Framework for Everyone

  • Django photo Django

    The Web framework for perfectionists with deadlines.

  • D3 photo D3

    Bring data to life with SVG, Canvas and HTML. 📊📈🎉

Recommend Topics

  • javascript

    JavaScript (JS) is a lightweight interpreted programming language with first-class functions.

  • web

    Some thing interesting about web. New door for the world.

  • server

    A server is a program made to process requests and deliver data to clients.

  • Machine learning

    Machine learning is a way of modeling and interpreting data that allows a piece of software to respond intelligently.

  • Game

    Some thing interesting about game, make everyone happy.

Recommend Org

  • Facebook photo Facebook

    We are working to build community through open source technology. NB: members must have two-factor auth.

  • Microsoft photo Microsoft

    Open source projects and samples from Microsoft.

  • Google photo Google

    Google ❤️ Open Source for everyone.

  • D3 photo D3

    Data-Driven Documents codes.